

Test Tool
Webswing Test Tool allows you to create test cases for your Swing or JavaFX application running in Webswing. Test tool is a web application that let's you record a test case, playback the test case and also automate multiple test cases using Selenium Grid.
Setup
You need to prepare following items to be able to run Webswing Test Tool:
- running instance of Webswing with the application you want to test - e.g. running on http://localhost:8080
- running instance of Webswing Test Tool - e.g. running on http://localhost:8888
- make sure your Webswing application allows connections from the test tool server, see CORS Origins in the Webswing application configuration
- make sure you have following configuration of your Webswing application - Session Mode = ALWAYS_NEW_SESSION, Max. Connections = 100, Auto Logout = OFF, Enable Test Mode = ON
- it is recommended to create and test in a maximized window with the same resolution
How to use it?
Start the Test Tool application by running testtool.bat on Windows, testtool.sh on Linux or testtool.command on OSX. You can configure server in jetty.properties similar to Webswing Server. There is also webswing-testtool.properties configuration file where you can configure following:
- config.hubUrl - Selenium Grid URL to be used in automated testing, must be accessible by Test Tool server
- config.testToolUrl - URL of Test Tool server that will be accessible from browser opened by Selenium node
- testtool.projects.folder - path to a folder where your Test Tool projects with recordings and test suites will be stored
- test.implicitWaitSec - implicit wait for assertion in seconds
- test.appInitWaitSec - wait in automated test run for webswing application to be initialized
- test.appStartWaitSec - wait in automated test run for webswing application to be started and ready to be tested
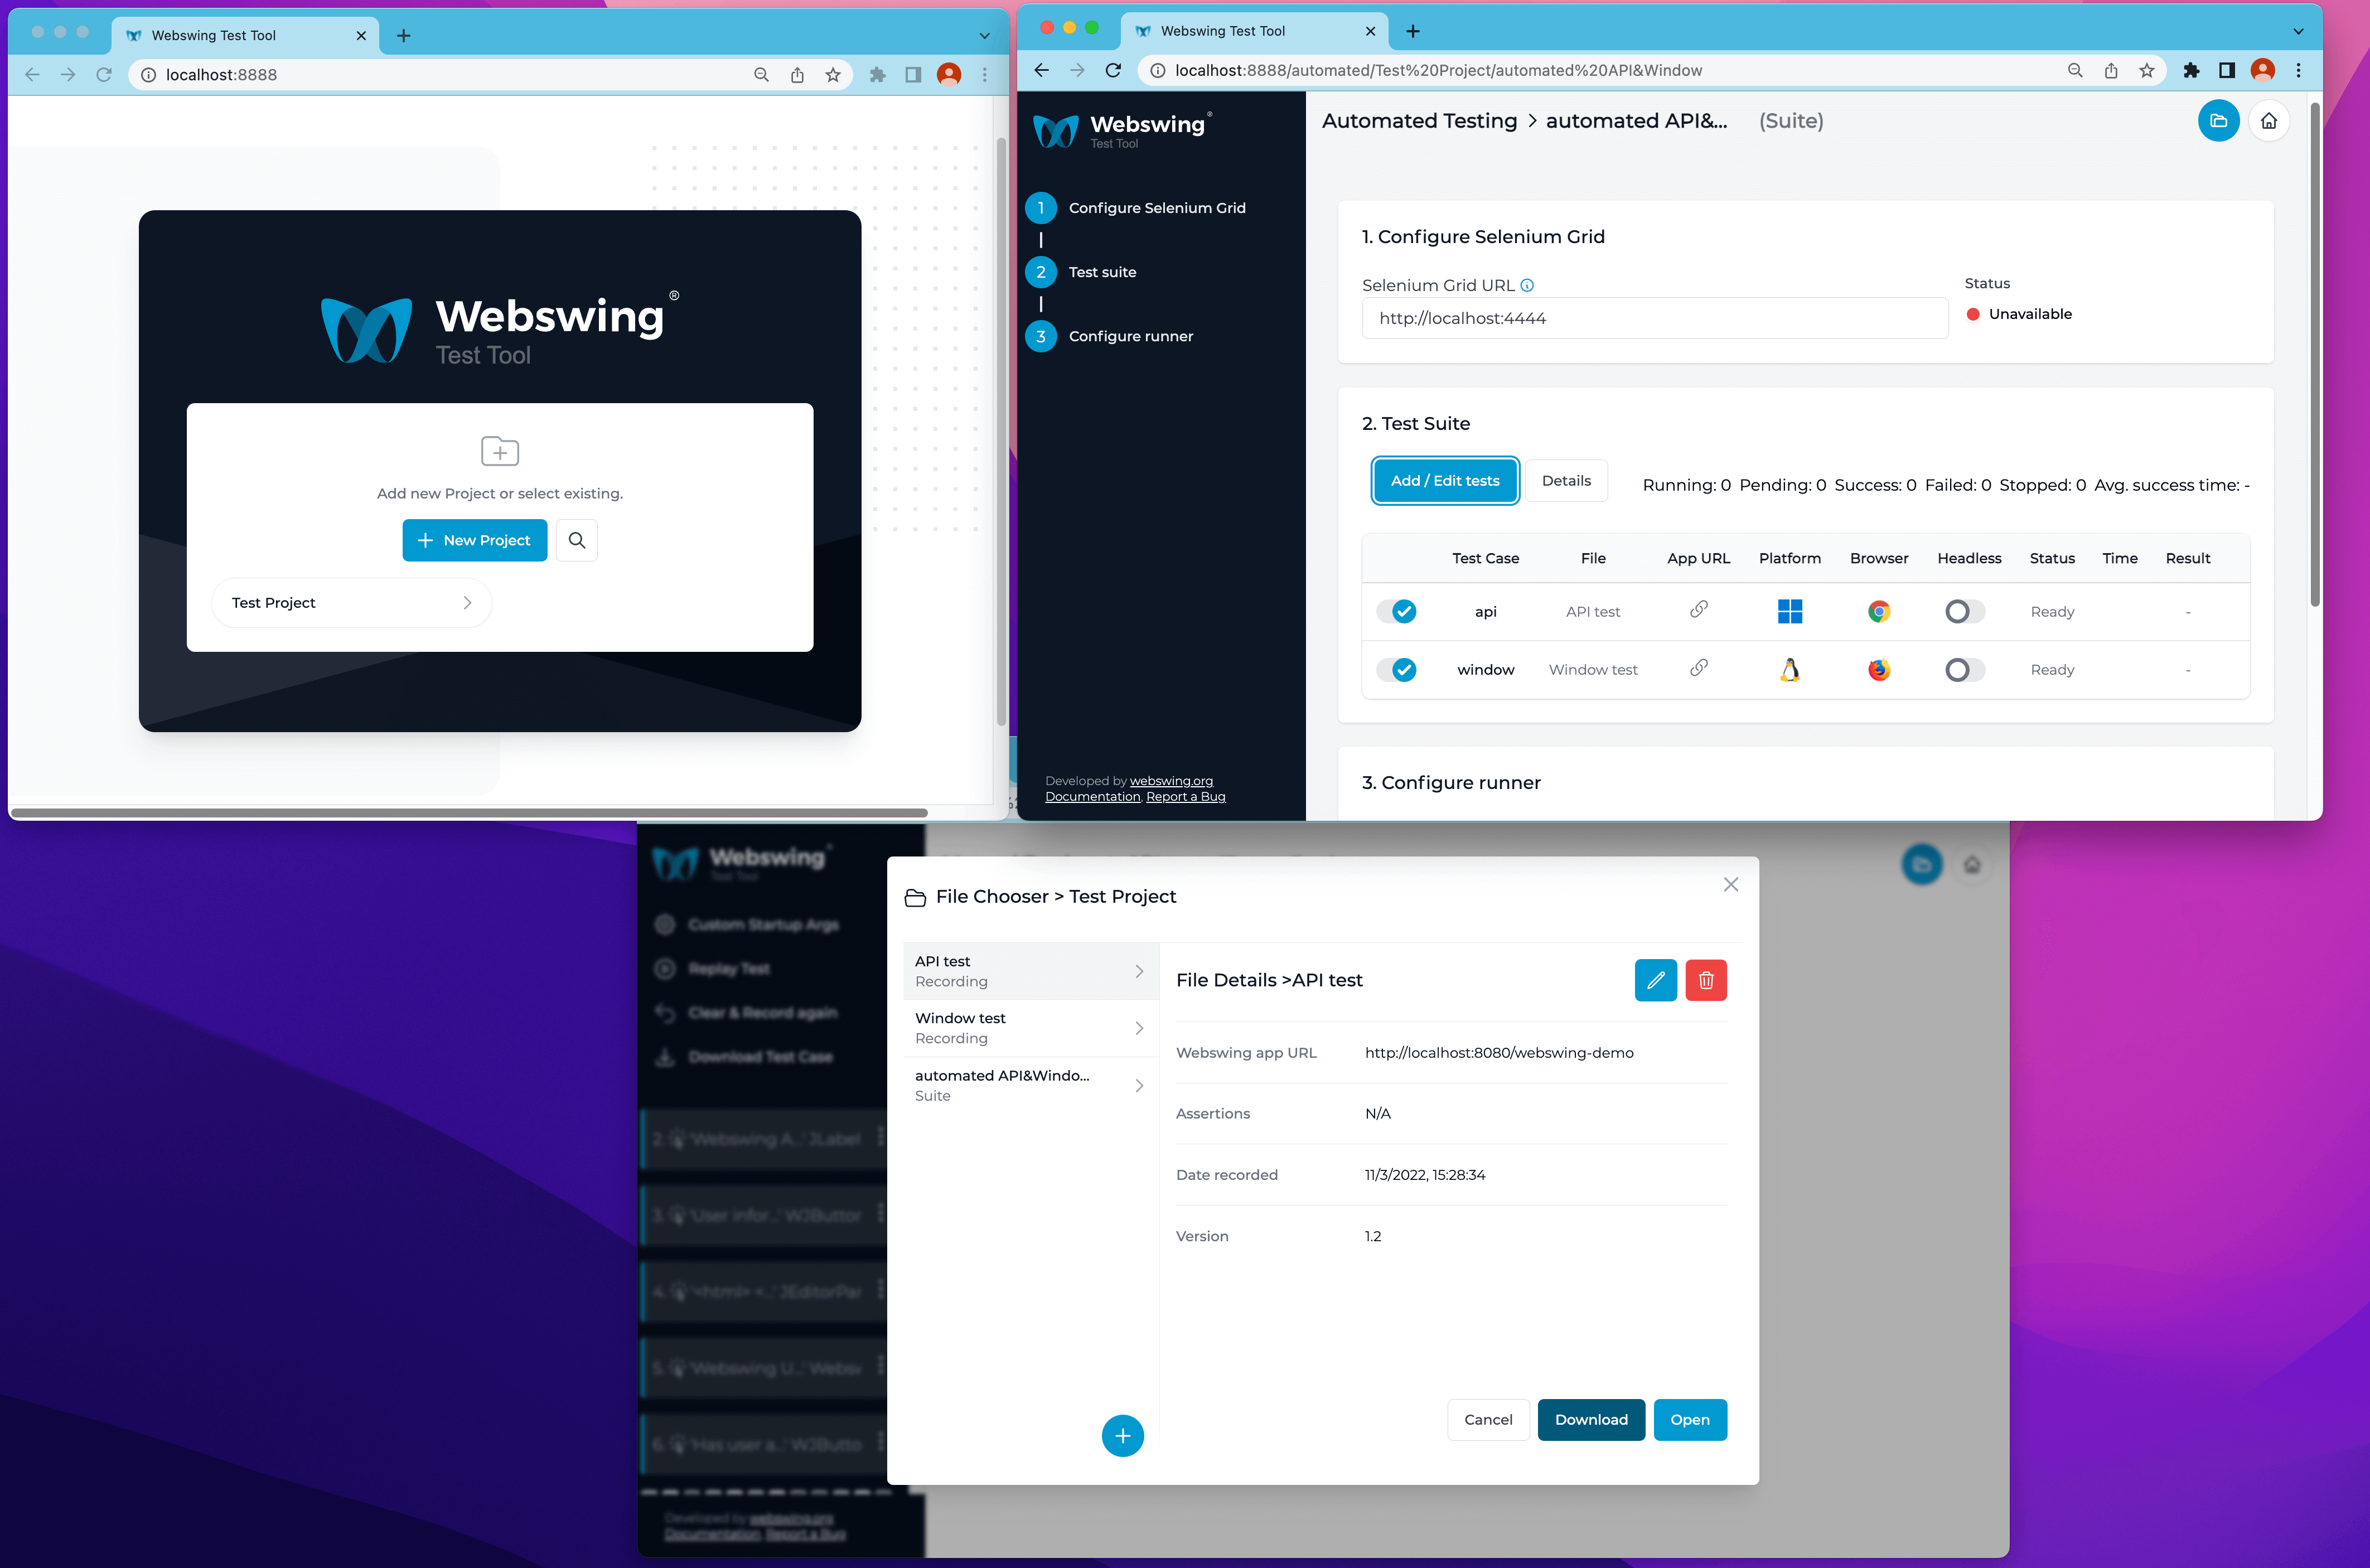
Open the Test Tool on http://localhost:8888. First you need to create a new project. This way you can group your recordings, test suites and parameter files. Selecting your project opens File Chooser dialog. Here you can manage your project files. Create new / upload existing / rename / delete / download and open the file.
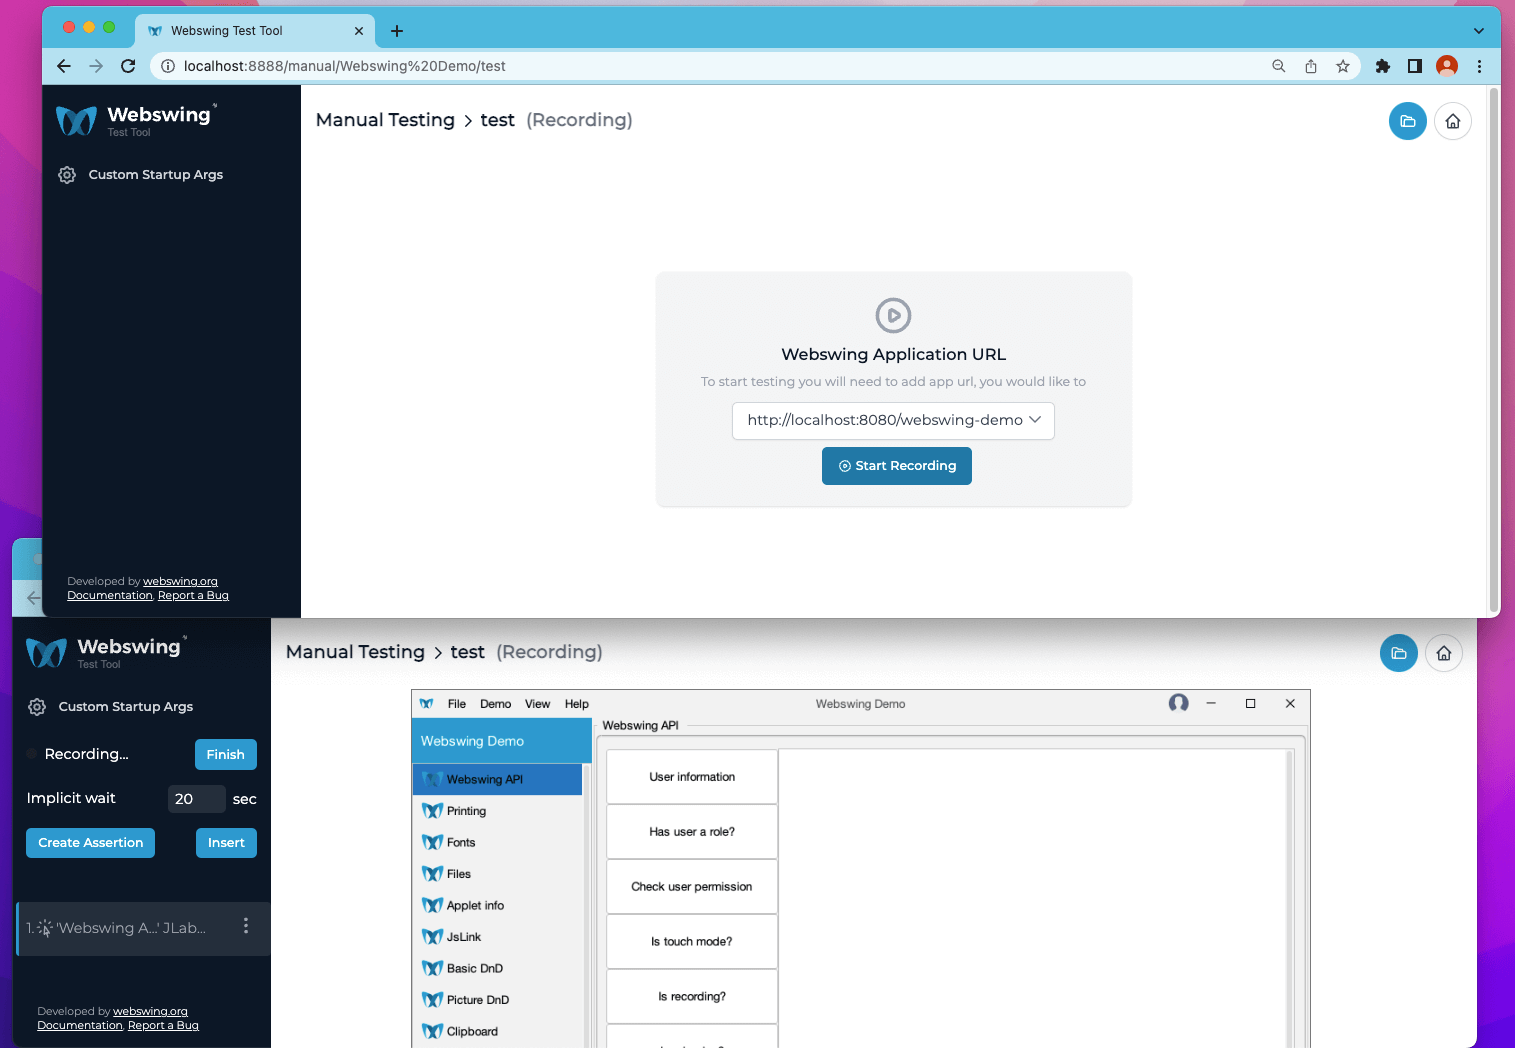
Manual testing
When you open a new recording file it will open in Manual testing mode. To record a test case enter URL of your Webswing application and start recording it. When you finish the recording phase all is automatically saved to the recording file. At this point you are able to replay the test case and also automate one or multiple test cases by creating a test suite file in the file chooser.
Setup
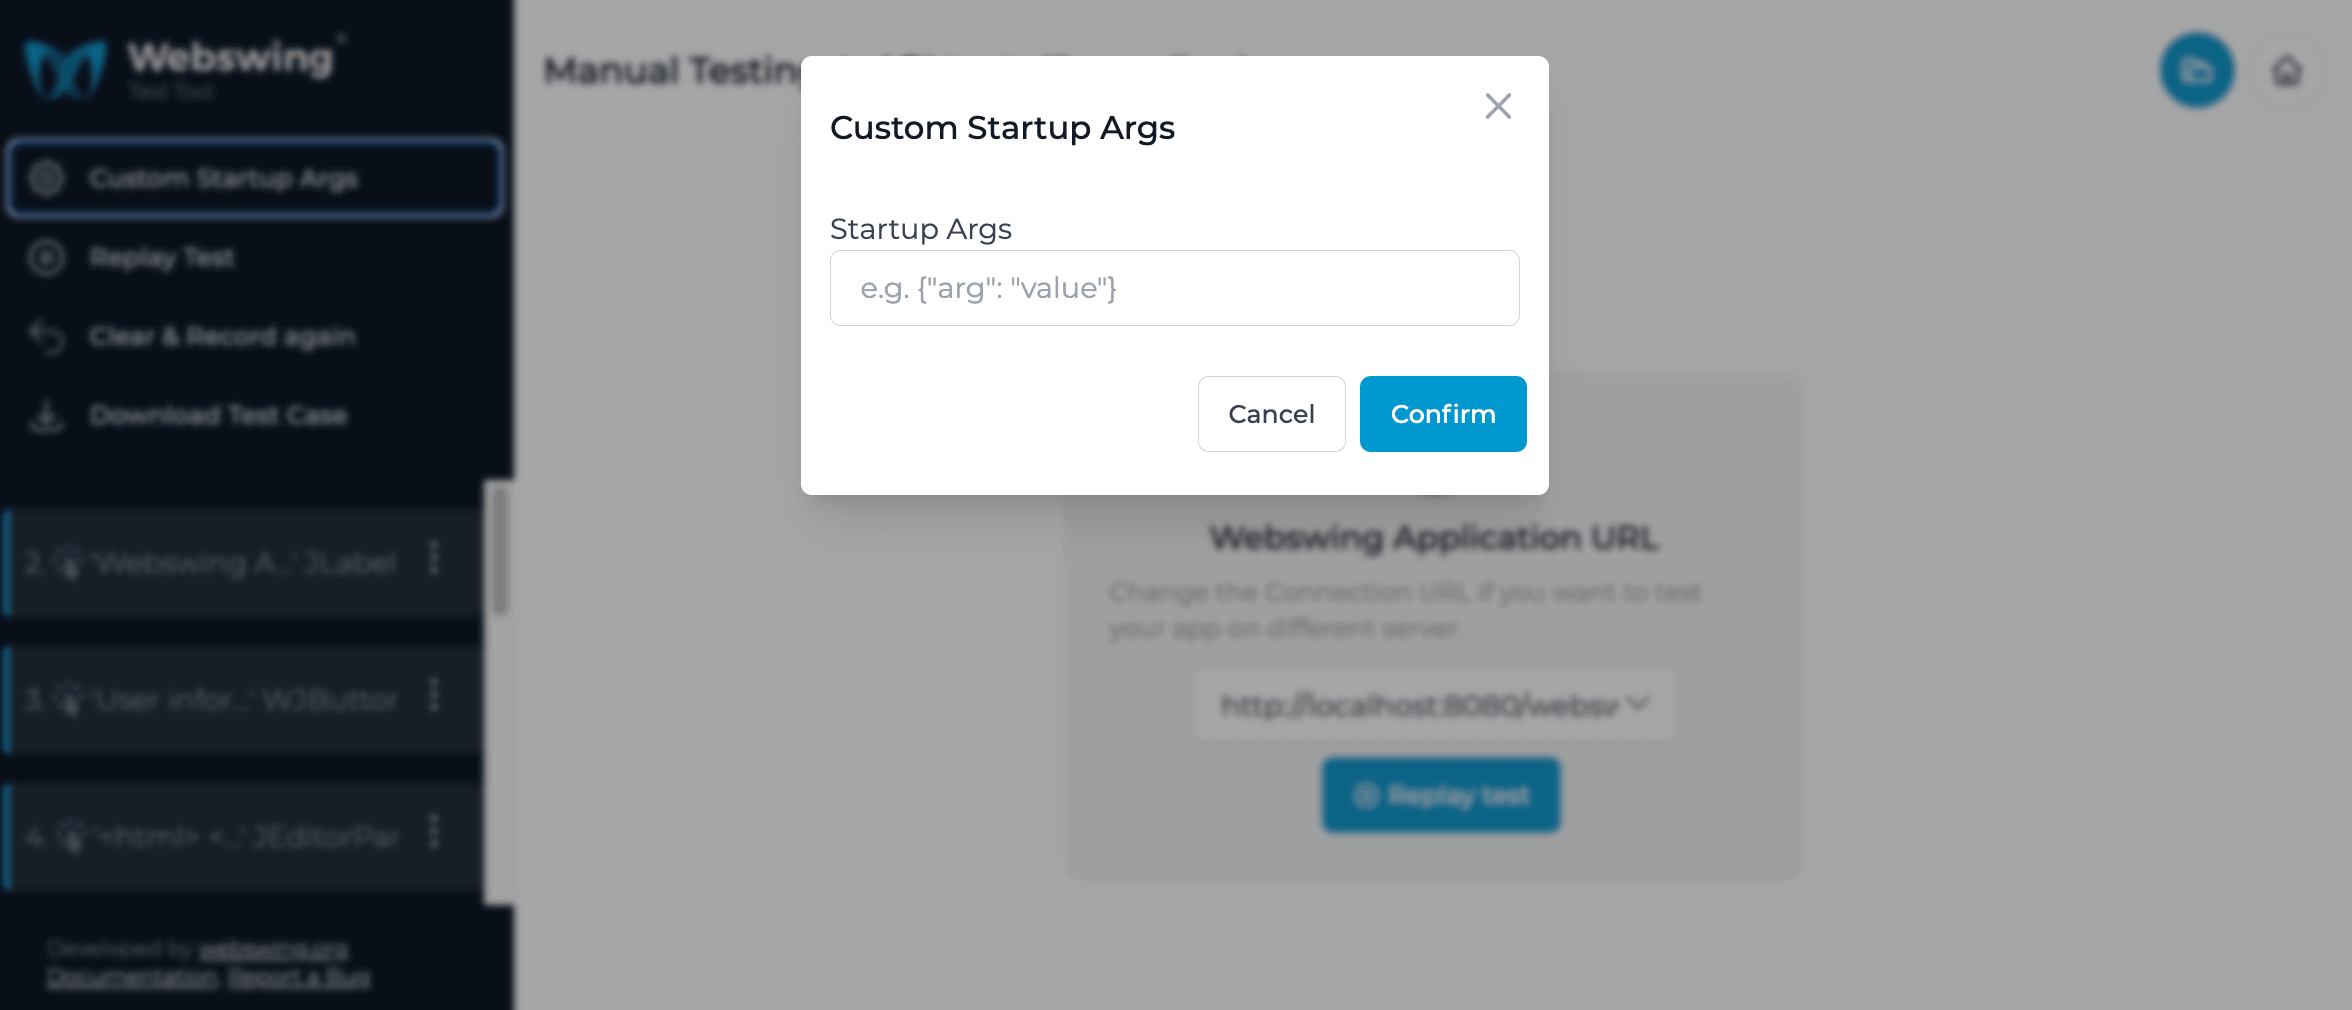
If your application uses custom startup arguments. You can find it in the left sidebar menu as first item with cog icon.
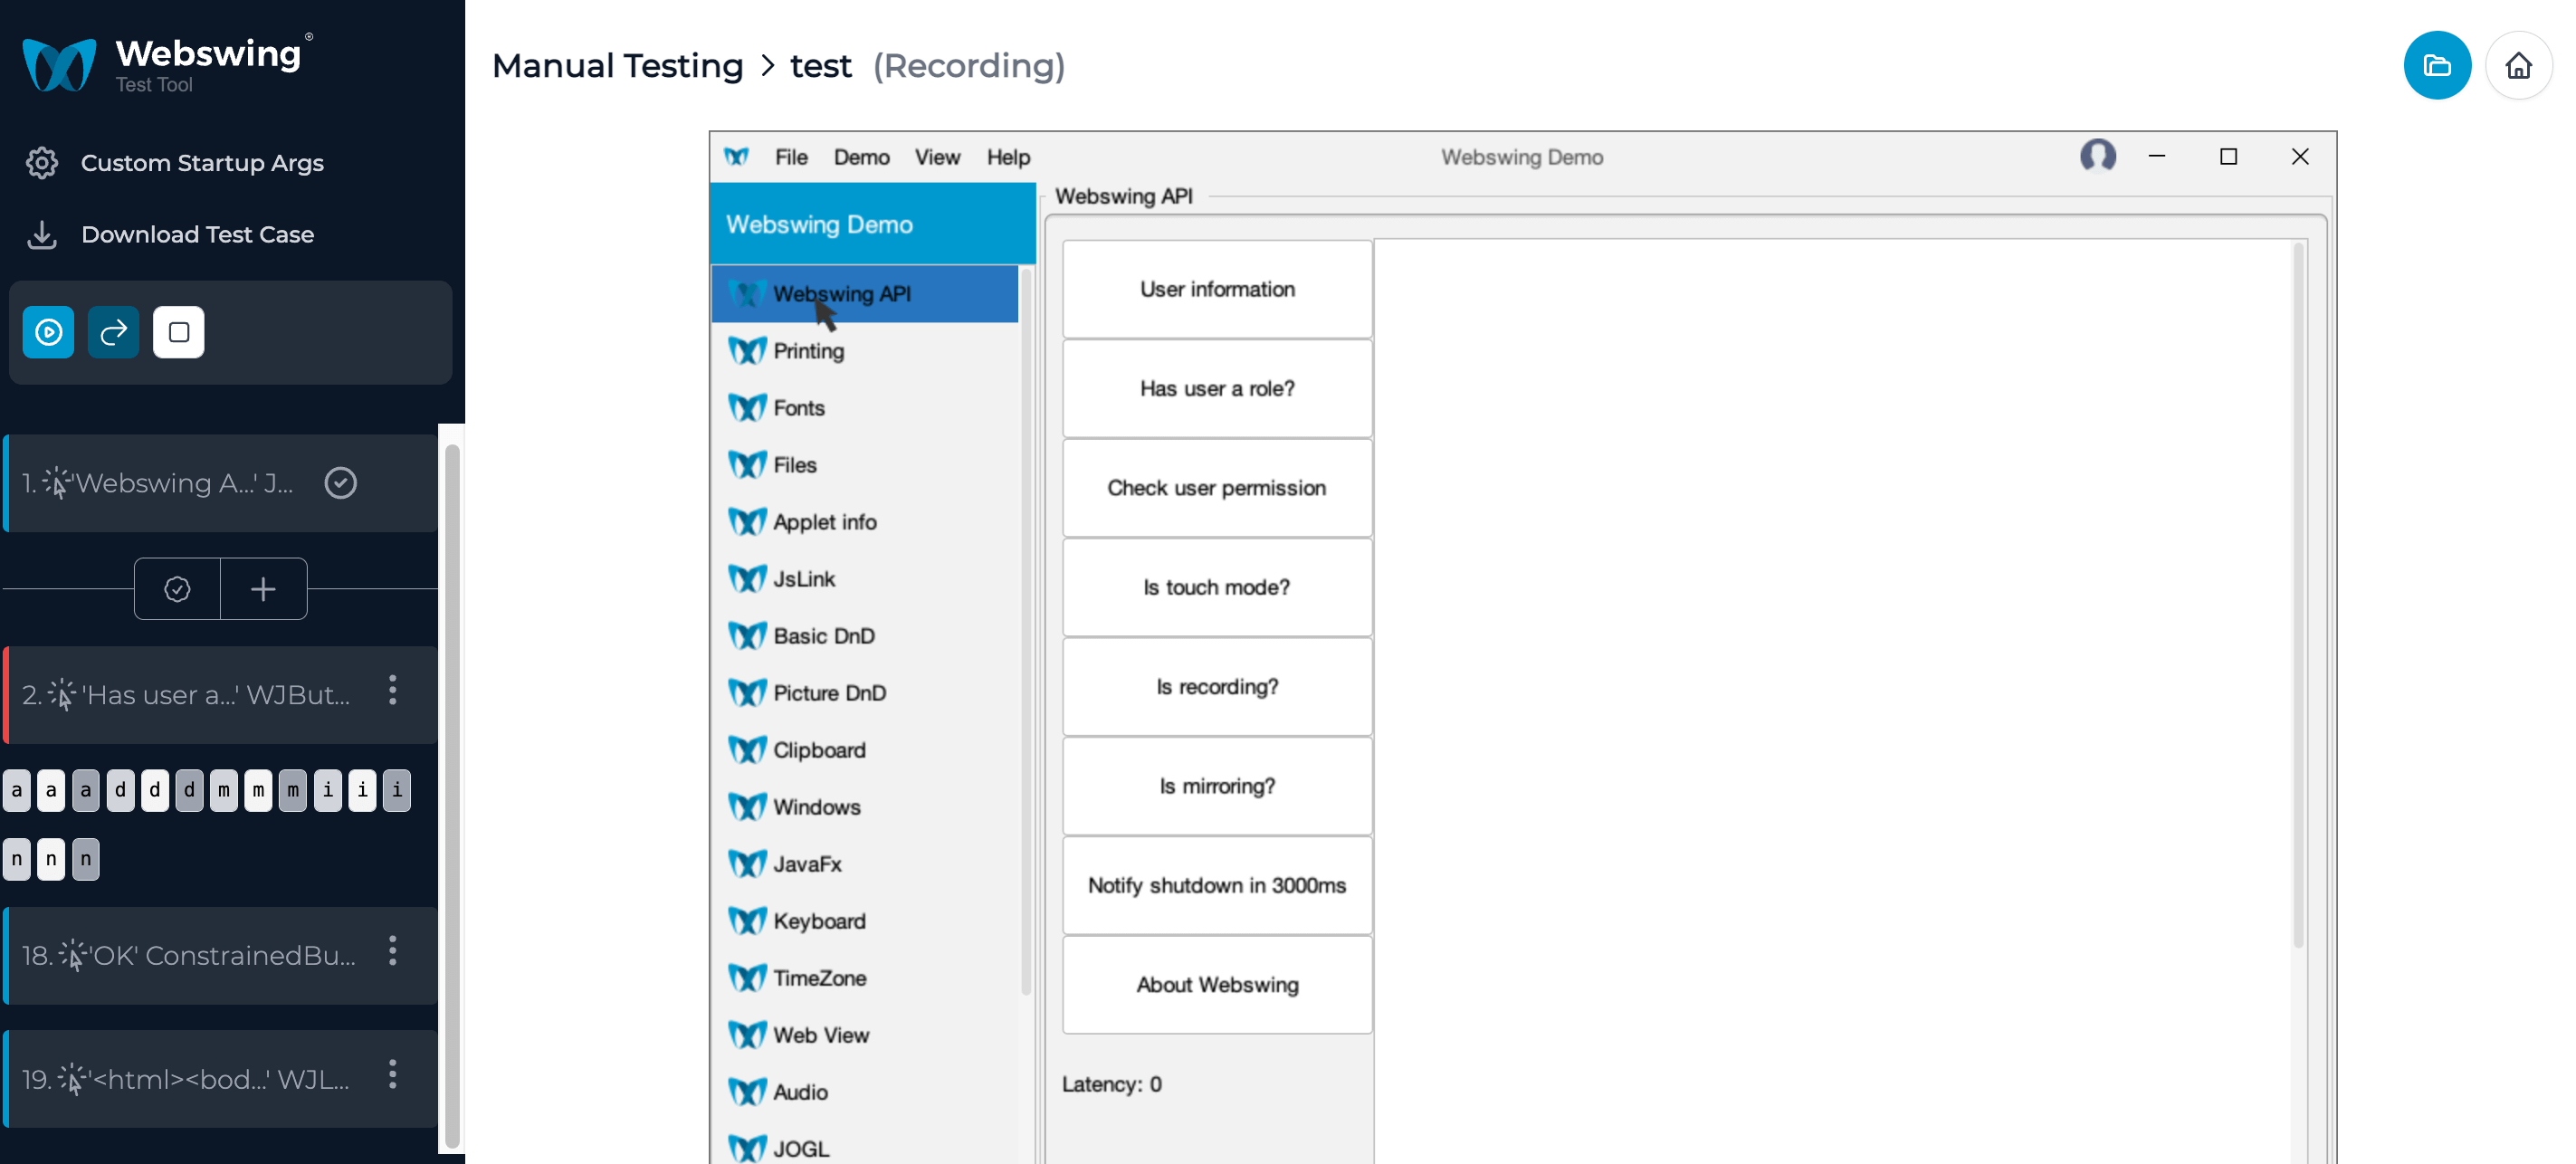
Start recording
Once you click the Start recording button the tool starts recording your actions with the Webswing application. Every time you click in the application a new assertion is created. An assertion is a set of properties that will be validated in the test case, like component type, value, path, etc. Path is especially important to be able to find and exactly identify the component when running the test later. These properties are coming from a component tree that is each time requested directly from the application, depending on the application size and structure, connection latency and performance of the environment setup this may take from a few milliseconds up to a few seconds, so please be patient after each click you make when creating a test case.
Following image link will bring you to our youtube video tutorial:

Note: Tutorial shows work on older versions of Test Tool, but the flow of this testing remains the same. We are working on a new tutorial series, which will show the new Test Tool.
Create assertion
After you have done some actions and you want to create a custom assertion, use the Create Assertion button. Now hover over the application with your mouse to pick a component in the application view. Click the component which you want to make an assertion for. Now check component properties in the toolbox which you want to be validated by the assertion. Click Add to save the assertion. The recording of test case now continues.
When typing text during test creation, it is recommended to first click on the input or text area component to make sure there is an assertion created for the input component, even if the input component is already focused when it appears in UI. This way you make sure the test tool runner first waits for the input component to appear in the UI and then starts typing the text.
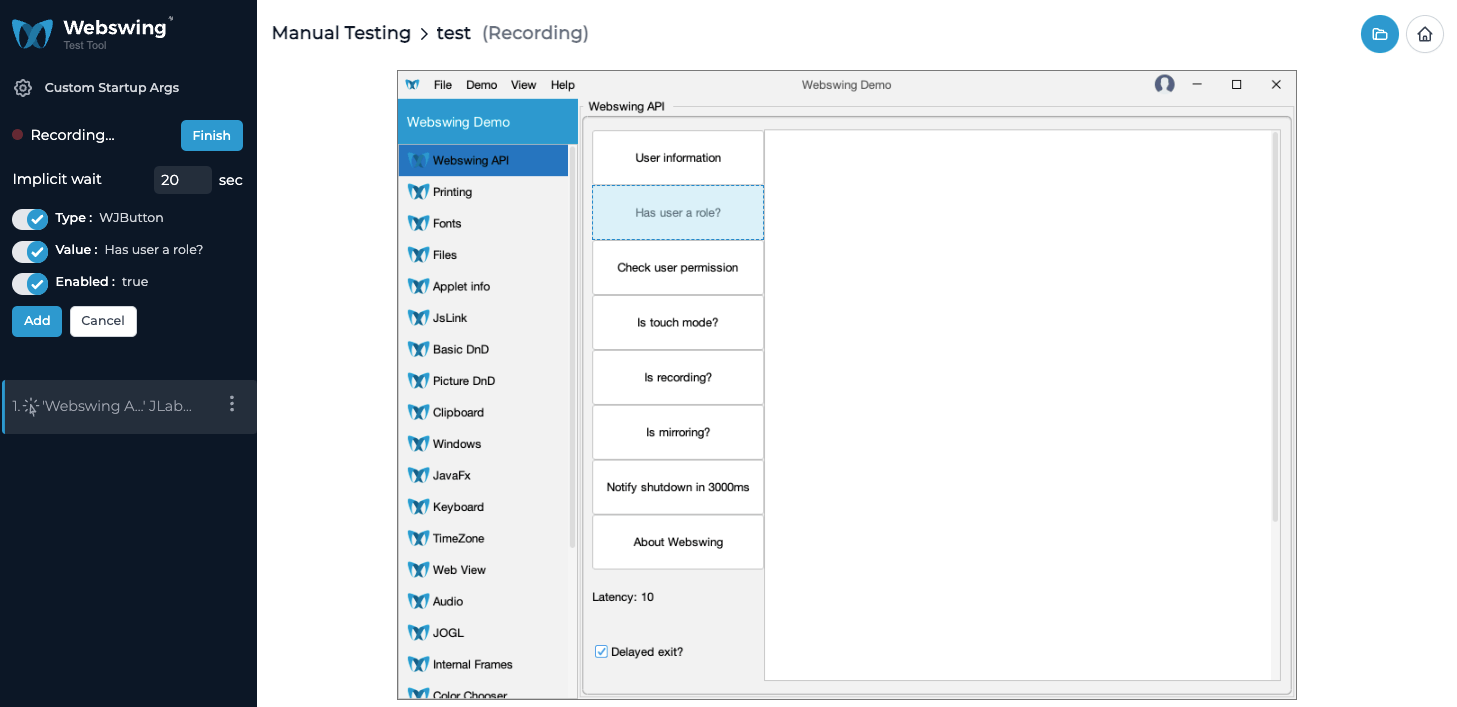
There is a 20 seconds implicit wait period by default. This is a time period that applies to all future created assertions and represents maximum wait time for the assertion to become valid. During this period, (while running a test case) test tool will try to validate the assertion multiple times until it passes. If the assertion fails to validate, the whole test case fails. You can adjust the implicit wait time at the beginning or during the test creation, or you can adjust explicit wait time for each assertion. You can also set a default implicit wait period in webswing-testtool.properties file test.implicitWaitSec = 20.
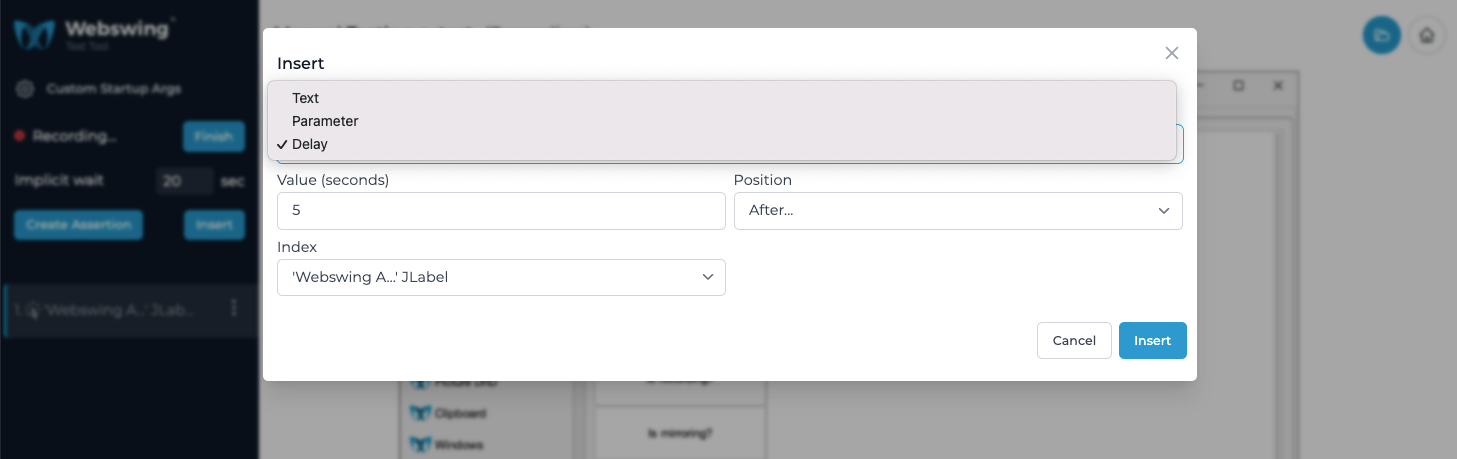
Insert
In addition to assertions you can also insert text, delay or a parameter using the Insert dialog. You can insert text and parameter only at the current position in test case. The inserted value will be immediately applied. Delays can be inserted at any position at any time.
Finish
When you are done with creating the test case click the Finish button. The tool will save your current recording to the file. You should be able to replay the tests you just recorded, download the test case or clear and record test case again.
Open and replay test case
Recording files are saved to the projects folder and you can open them from the file chooser. To run a test click Replay Test. You will now see a playback of your recorded test case. Assertions are validated in the toolbox. There are also options to pause the playback, make a single step (disabled until there is a breakpoint) or stop playback. When you are replaying your recording and something is missing or you are not satisfied with it. You can either set a breakpoint before playback, or pause on next step. When the replay is paused you are able to edit assertions / create an assertion / insert (text, param, delay) / go to next step or continue playback.
When the test finishes you can see and download the test results from the toolbox.
Following image link will bring you to our youtube video tutorial:

Note: Tutorial shows work on older versions of Test Tool, but the flow of this testing remains the same. We are working on a new tutorial series, which will show the new Test Tool.
Automating test cases
To automate the recorded test cases you have to create a Test Suite file. Open your project in file chooser and create a new Test Suite file. Open the new file and Automated testing view will open.
Following image link will bring you to our youtube video tutorial:

Notice: Tutorial shows work on older versions of TestTool, but the flow of this testing remains the same. We are working on a new tutorial series, which will show the new TestTool.
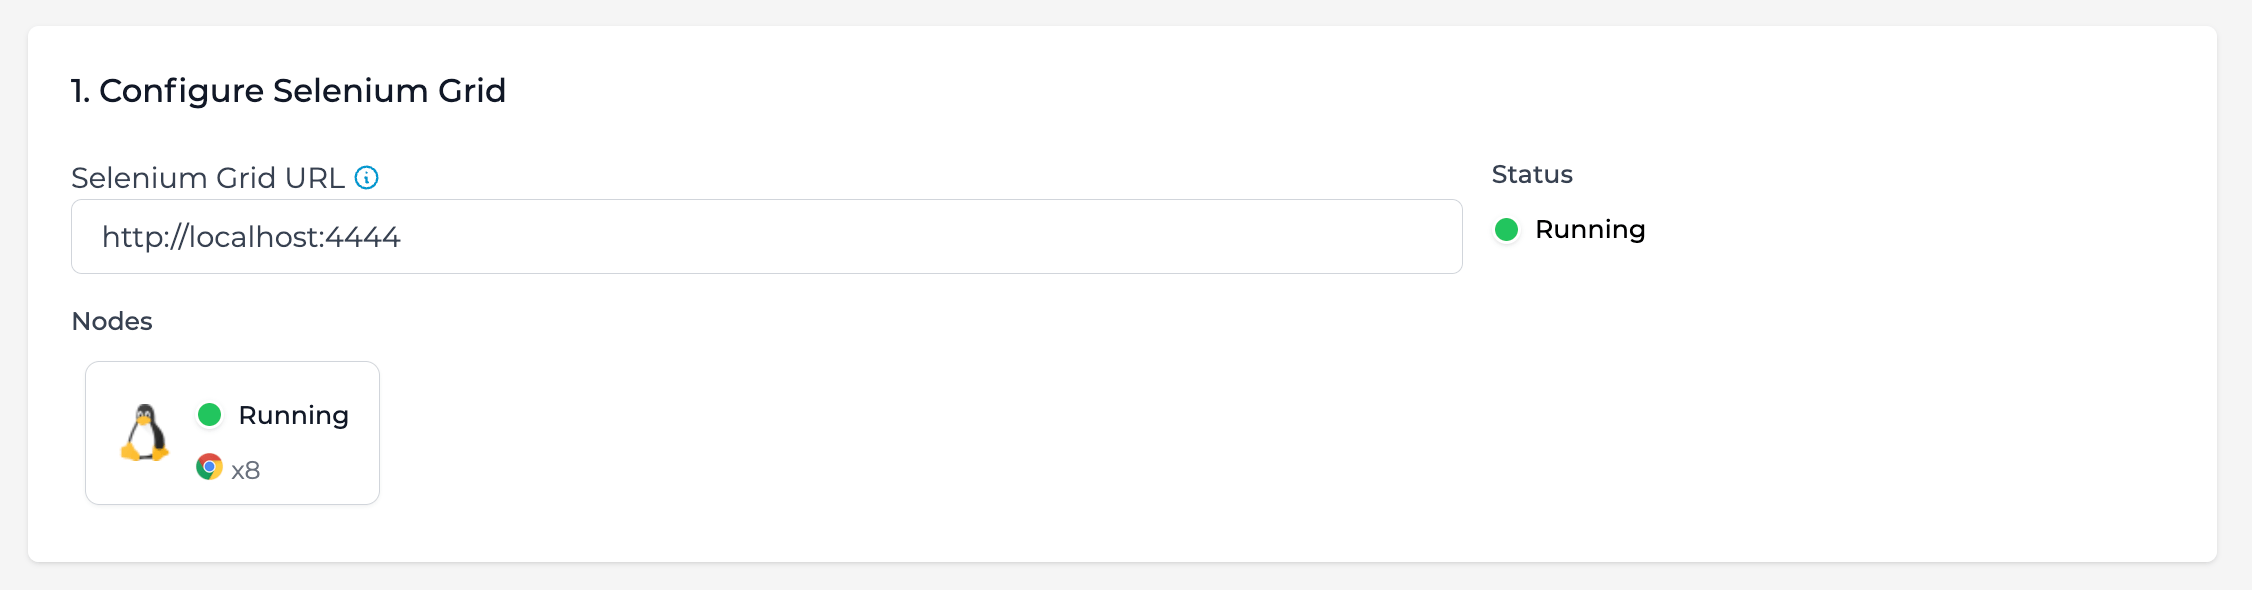
Selenium Grid
First configure your Selenium Grid. Enter the URL of the running Selenium Hub, e.g. http://localhost:4444. The connection will be validated, wait until you see Status: Running. Test Tool also tries to retrieve information about running nodes.
Test suite
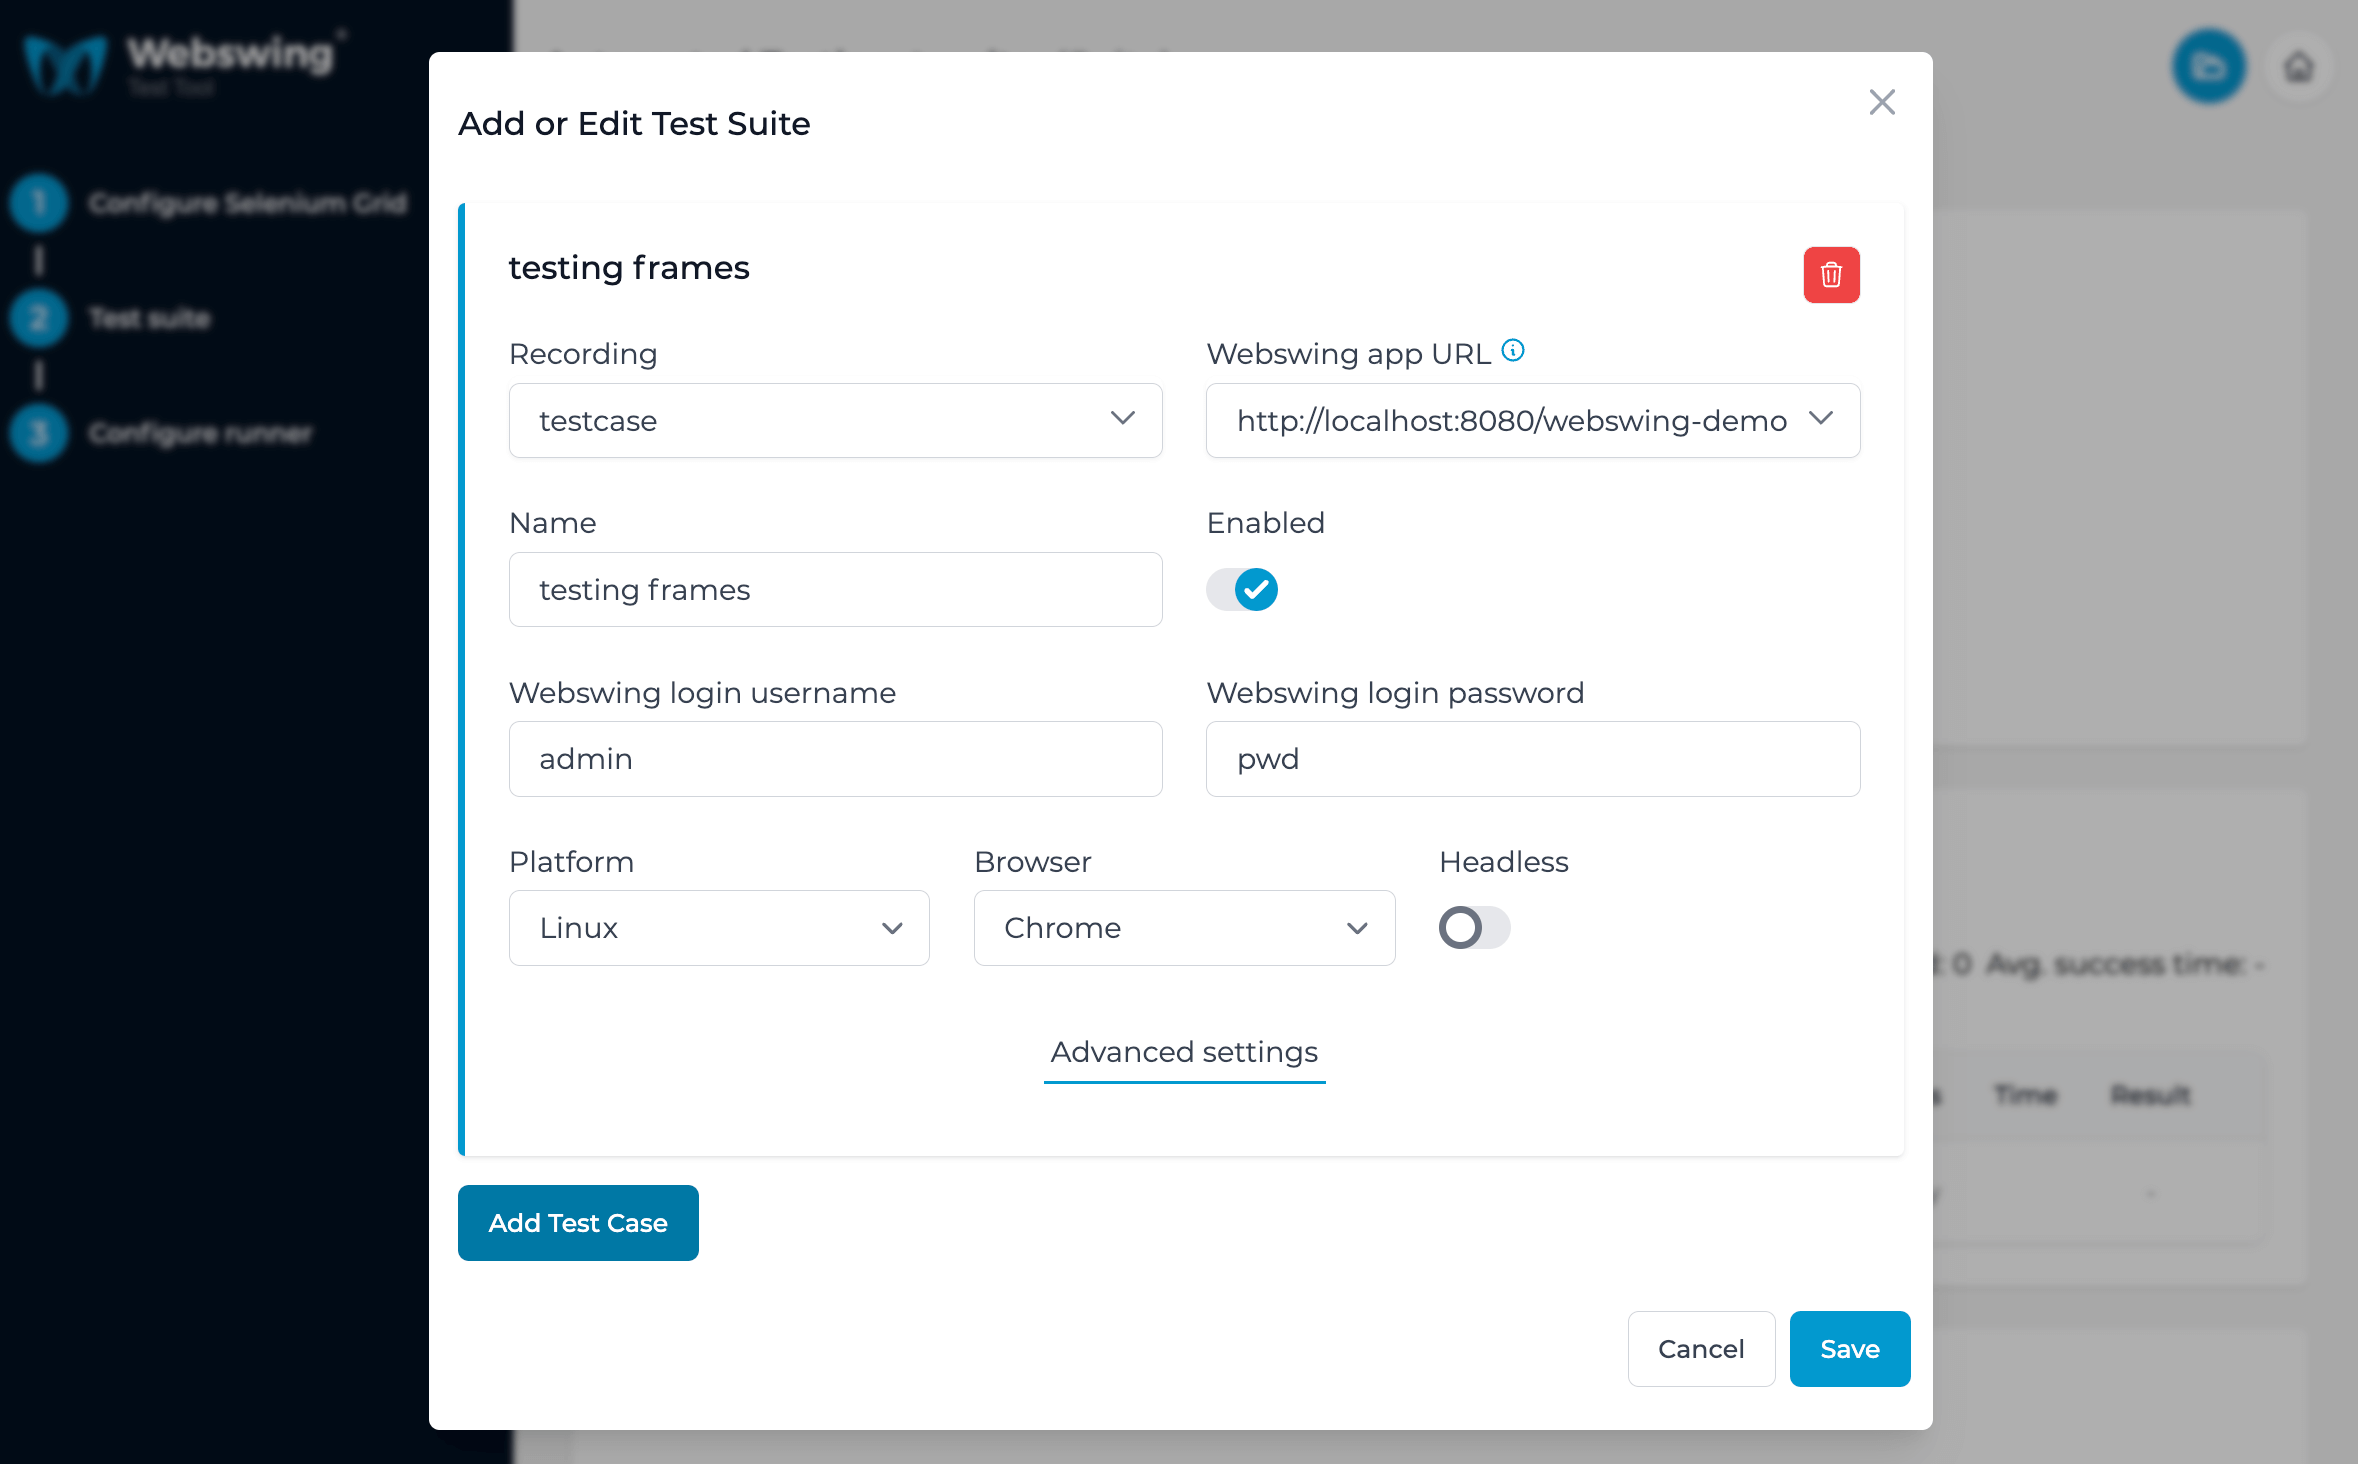
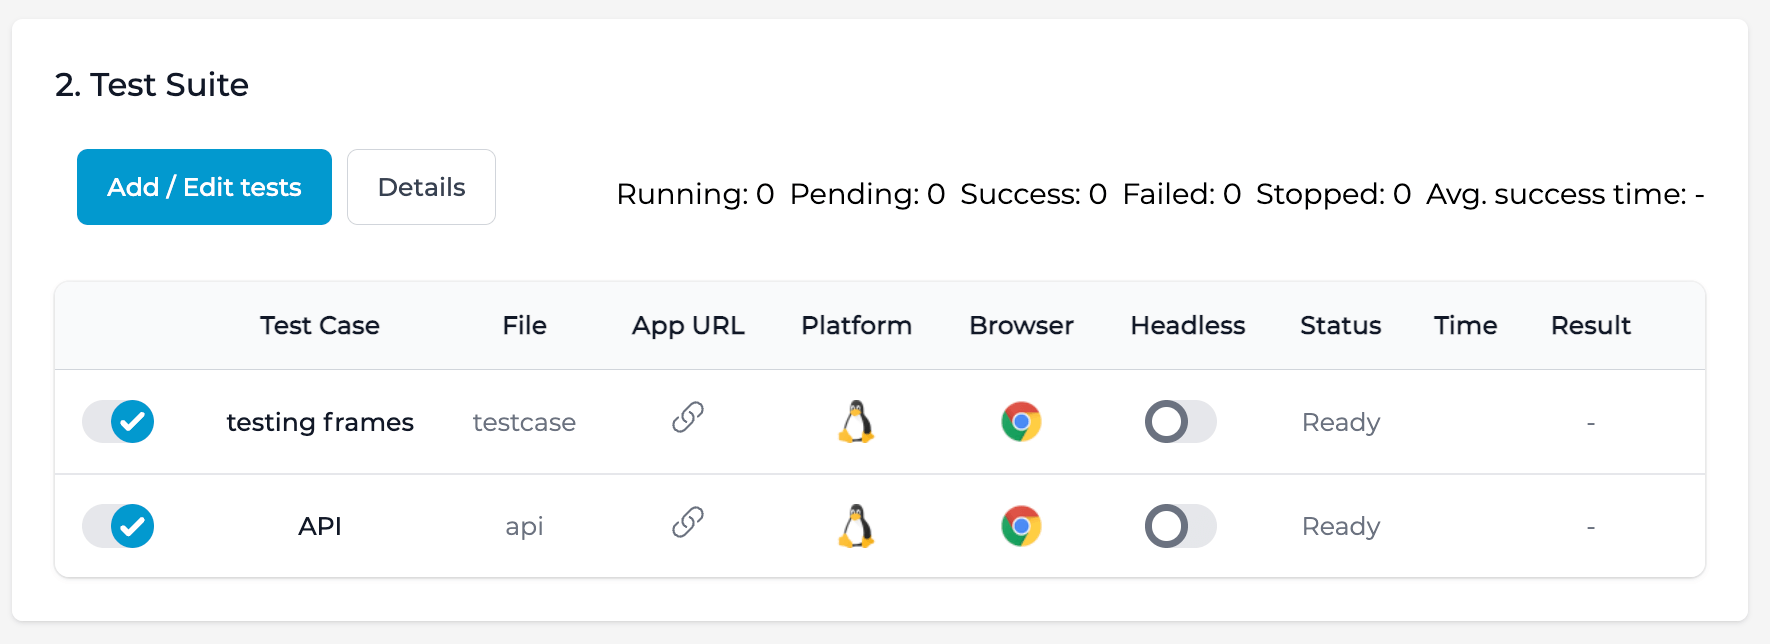
To automate Webswing test cases you have created, you need to define test cases. A test suite is a simple configuration file where you define which test cases to run and other options.
You can add or edit the test cases using the Add / Edit tests button in the second step. Pick a recording from a list of recording files in the current project. Make sure to choose Platform and Browser based on the availability of the environment on your Selenium nodes. After you save the edited test suite it will be stored in the file.
The test suite table is showing the test suite configuration, status, time, and result after you run the test. You can also check a detailed view of the results by clicking the Details button.
Test runner
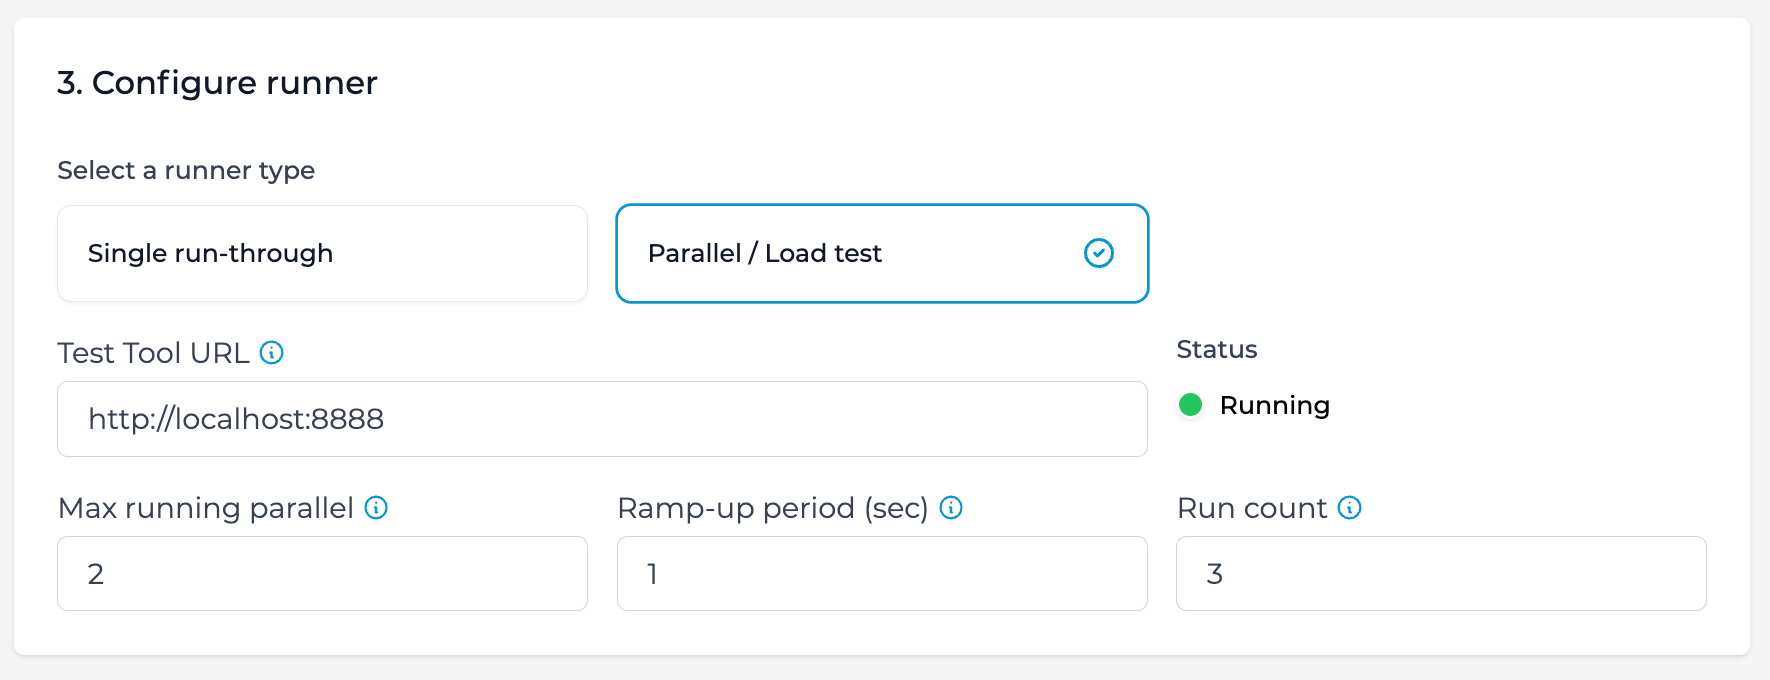
Finally, configure the test case runner. Enter the URL of test tool server instance (this can be the same instance, i.e. http://localhost:8888 or some other instance). This URL must be accessible from the Selenium node.
You can choose between a single run-through or a parallel run. Single run-through will simply execute test cases one-by-one, one instance at a time.
With parallel you can set how many instances you want to run at the same time (Max running parallel). Use Ramp-up period to define how long should it take to start the Max running parallel instances. For example if you want 10 instances in parallel and start them in 100 seconds, there will be 1 instance started every 10 seconds. After 100 seconds the next instances start ad-hoc after a previous test finishes. To control how many test will run in total, set Run count. This value is per test, so if you have 3 tests in your test suite and run count set to 10, the runner will run 30 instances total, 10 per each test.
Start automation
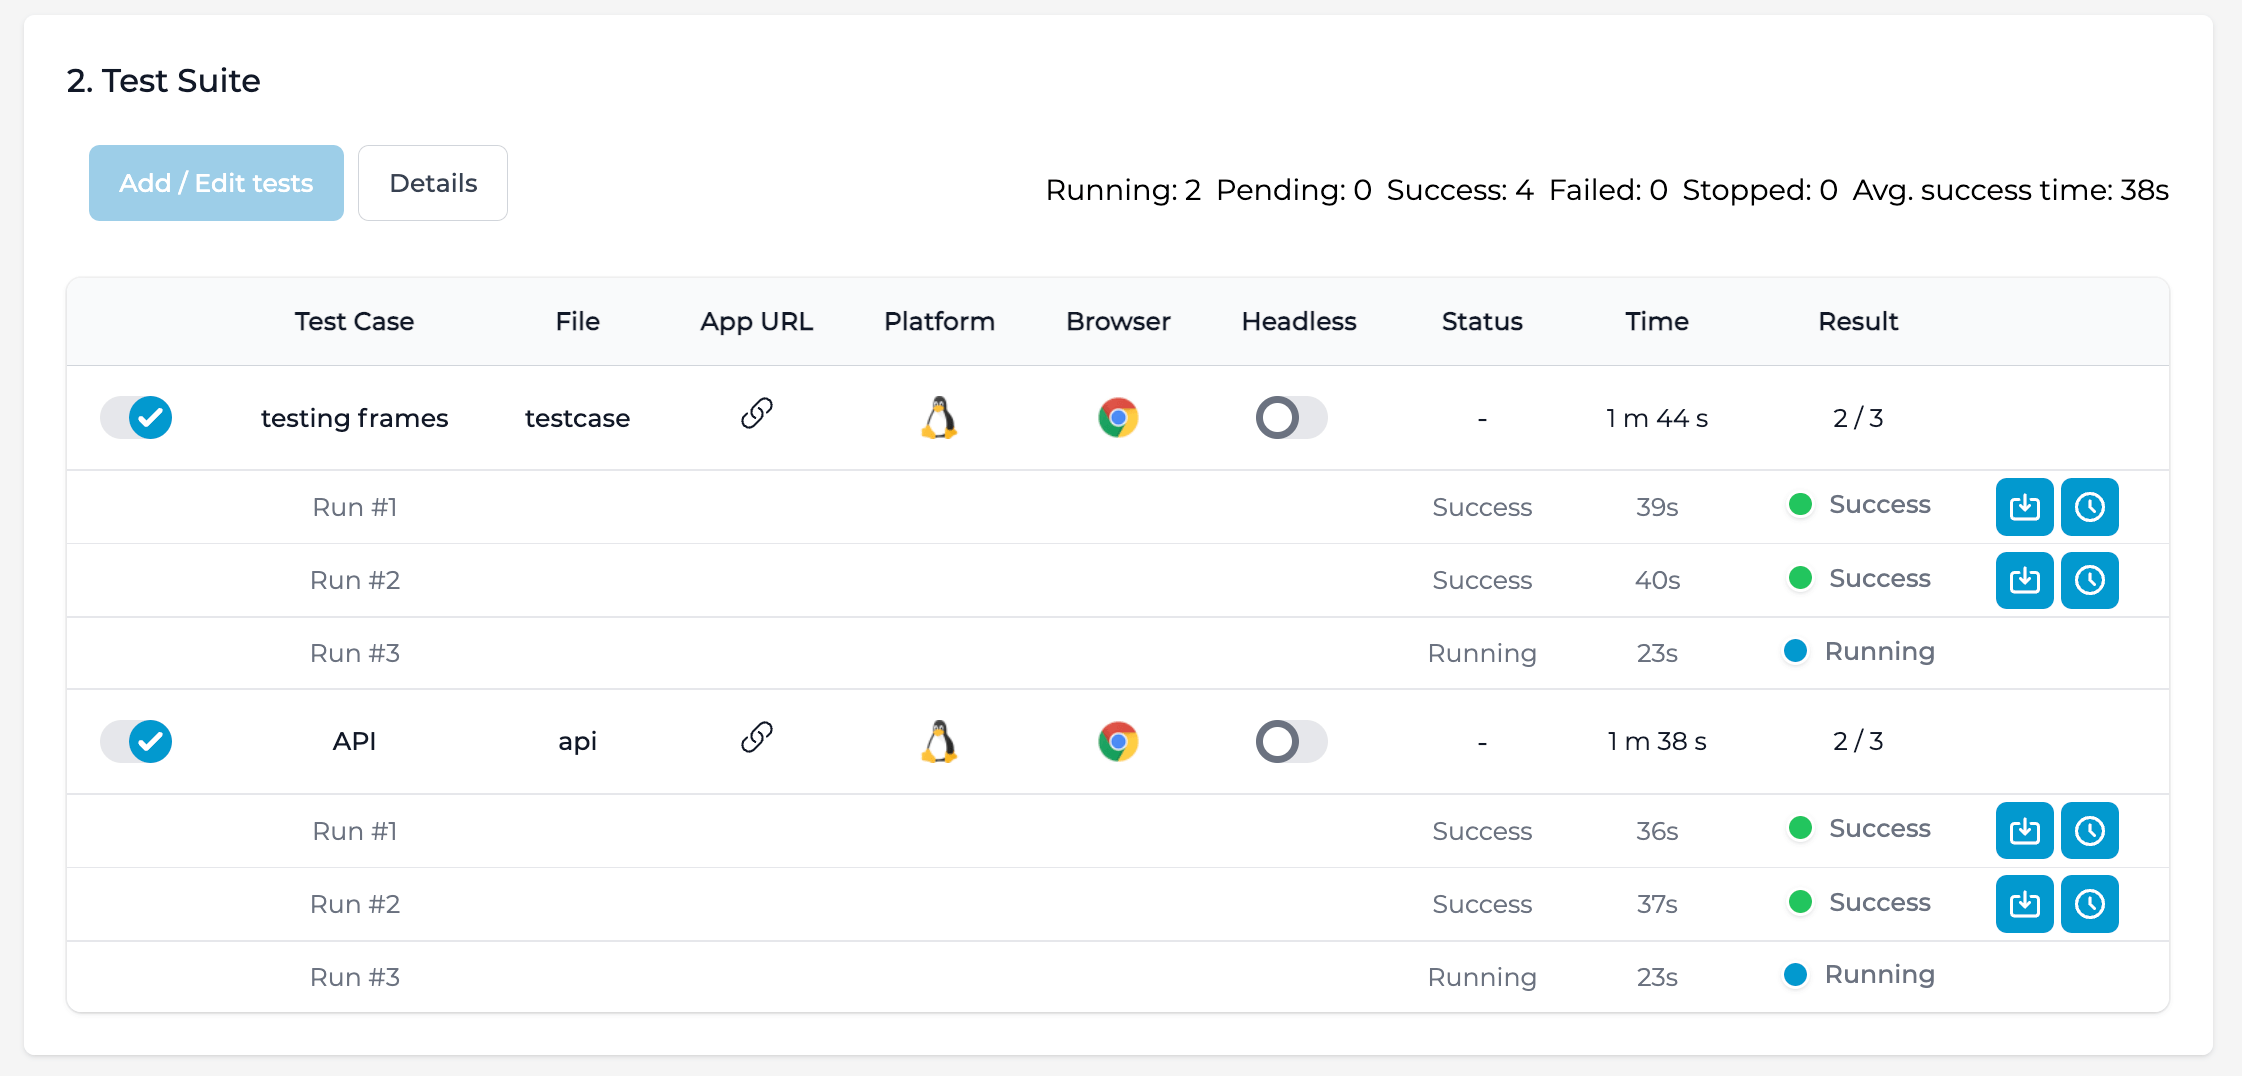
Press Start to start the runner. You can see the progress in the test suite table. If the test case is successful the row turns green, otherwise red. For a failed test case you can take a look at a screenshot from the browser from the time the assertion failed or exception occurred. You can also see exception stack trace from test case and optionally also browser console logs (Chrome, Edge).
You can also stop the runner from execution, but please note that the runner is based on thread execution of test cases and it is not possible to stop the tests right away. Stopping the test runner sends a signal to stop running tests and to not run new tests. Currently running tests will eventually end. Some tests may fail due to stopping the runner, so make sure you do not take these into account when evaluating the results.
To see assertion times click Details button which opens a new window with results timings.
For monitoring CPU and memory usage, please do not rely on Webswing Admin Console as it only shows data of currently running sessions. Use resource monitoring tools provided by the operating system or cloud provider.
Selenium Grid Setup
You can setup a Selenium Grid either in your local environment or use a 3rd party service. Please note that current Test Tool supports Selenium version 4 only.
For a 3rd party service just search for "Selenium Grid in cloud" or use one of these - https://www.gridlastic.com, https://saucelabs.com, https://testingbot.com, https://seleniumbox.com.
To setup Selenium Grid yourself please refer to the Selenium documentation.
Automated test REST API
There is a simple REST API in case you want to execute a test suite with one or more tests from an external application, e.g. for a Webswing server health check.
Send a POST request to http://localhost:8888/rest/runTest, set Content-Type header to application/json with following body:
{
  "parallel": false,
  "maxRunningParallel": 1,
  "rampUpPeriod": 1,
  "runCount": 1,
  "testCaseParameters": [{
    "project": "project 1",
    "file": "test 1",
    "name": "Test",
    "webswingAppUrl": "http://localhost:8080/webswing-server/webswing-demo",
    "webswingUsername": "admin",
    "webswingPassword": "pwd",
    "platform": "WINDOWS",
    "browser": "chrome",
    "headless": false,
    "enabled": true
  }]
}
Adjust the parameters to your needs, you can also let the tests run in parallel, similar to the automated testing web UI.
Keep in mind that you get response after all the tests you specified finish, so make sure to watch the timeout. If all tests finish successfully you get a 200 OK response, otherwise you get 500 Internal Server Error.
QF Test
For more complex testing of GUI functionality you can use a 3rd party solution QF-Test.