

AI is transforming software development by making code generation faster and more accessible. But as coding becomes cheaper, verifying correctness, maintaining quality and ensuring reliability remain critical challenges. Discover why the real cost of AI-assisted development lies beyond writing code.
What a survey of 40 developers, testers and other technical professionals found
Code is cheap. Proof is expensive.
3 Key Findings
- AI speeds things up. 87% of respondents code faster with AI. Answers came from those who could judge it.
- You still need to read your code to catch bugs. Two or more escaped bugs were reported by 87% of people who read at most half of the AI code, versus 46% among those who read most or almost all the generated code.
- Verification has a price. People who read most or almost all AI code reported a median weekly saving of 15 hours, compared with 25 hours among those who read at most half.
Detailed statistics and the tests used are presented throughout the article. A dedicated section, “Methodology and statistical details,” at the end explains the statistical methods used.
Why this survey was run
At the end of July this year, I analyzed 31 studies published in 2025 and 2026 and asked whether coding with AI is better than coding without it. In the original article, I looked at four dimensions:
- Quality and Durability
- Speed and Output
- Build Success
- Behavioral Equivalence
The studies I summarized in July compared work, mainly through pull requests, so their measurement was based on observed project output. However, this survey looks at a different matter: developers reporting their own experience from the previous four weeks.
Original article: https://www.linkedin.com/pulse/ai-coding-better-than-human-igor-gembula-cgvnc/
The earlier analysis showed that these four indicators do not have to move in the same direction. AI can increase output and speed up code creation, but that does not automatically mean better code, shorter review, a successful migration, or preserved business behavior. Preserved business behavior plays a crucial role while modernizing legacy applications.
This time I did not want to read another set of studies. I wanted to see whether the same pattern appears among people I work with day-to-day.
Most respondents come from two companies where I am involved. ObviousFuture was built around AI research from the start and develops on-prem AI for understanding audiovisual content. We published our first models even before ChatGPT was released. We had been working on AI for roughly five years before the global AI hype, so AI expertise in this team is very high by nature.
Webswing develops technology for modernizing legacy enterprise applications into web environments and has its own AI research focused on modernization. AI modernization builds on procedures proven over years: modernize step by step in a controlled environment, verify the result continuously, and be able to roll back when a step fails. Before AI, the customer coded each step manually. Today AI helps with that coding. The controlled process and preservation of original behavior still remain the foundation.
I do not compare the two companies with each other. With this sample size and very different group composition, company-level differences would be easy to over-interpret.
Other respondents come from my broader technical circle. My son Jakub and some of his classmates from Fontys University also participated. Some of my friends who are developers, as well as colleagues from previous projects, also took part in the survey.
Who we compare
I use two different views of the same sample. By experience, I compare Juniors with up to 3 years of experience (n = 17) with Seniors with at least 10 years (n = 17). Four respondents with 4-9 years of experience and one respondent with unknown experience are outside this two-group comparison. Junior and Senior refer to years of experience throughout the article, not student status or job title.
By AI intensity, I split respondents into Heavy users, who use AI in more than 75% of their work tasks (n = 17), and Moderate users, who use it in 75% or less of their work (n = 23). These labels describe intensity only, not skill or quality of work.
The two axes overlap. A person can be both a Senior and a Heavy user. I therefore do not treat results from the two splits as independent confirmations of the same conclusion.
The overlap is: Juniors 6 Heavy and 11 Moderate; Seniors 10 Heavy and 7 Moderate. Across Junior and Senior together, that is 16 Heavy and 18 Moderate. Six respondents sit outside the Junior/Senior split.
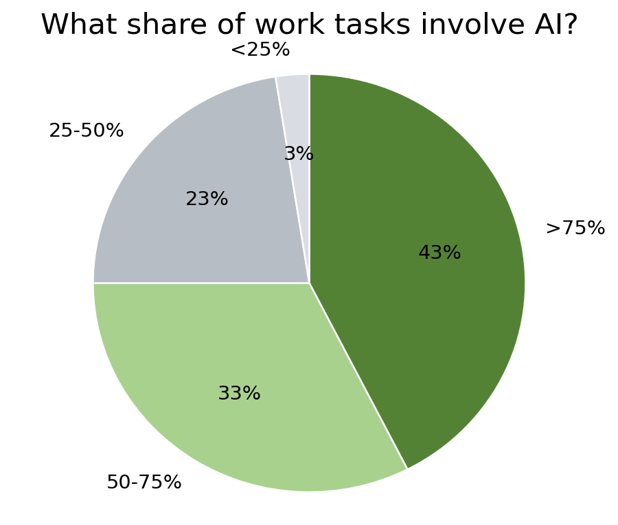
Figure 1. Intensity of AI use
Heavy users are 17/40 respondents (43%) and use AI in more than three quarters of their work tasks. Moderate users are the remaining 23/40. The colors only indicate intensity, not quality.
How to read the numbers
Percentages are calculated from people who could evaluate the specific question. Exact numerators and denominators are shown where they matter. Stars summarize the p-value: *** p < 0.01; ** 0.01 <= p < 0.05; * 0.05 <= p <= 0.15. The lower the p-value, the stronger the statistical evidence for a difference or relationship. Descriptive results without a test do not get a star.
A quick view of the four analyzed groups
Junior (n = 17): AI in at least half of work 82% (14/17); faster working code 81% (13/16); AI still saves time after checking/fixing 88% (15/17); reads most AI code 44% (7/16); rewrites at least a quarter of AI-generated code 25% (4/16); reports 2+ escaped AI bugs 57% (8/14); median weekly savings 20 h.
Senior (n = 17): AI in at least half of work 76% (13/17); faster working code 94% (16/17); AI still saves time after checking/fixing 71% (12/17); reads most AI code 53% (9/17); rewrites at least a quarter of AI-generated code 53% (8/15); reports 2+ escaped AI bugs 73% (8/11); median weekly savings 20 h.
Heavy (n = 17): AI in at least half of work 100% (17/17); faster working code 82% (14/17); AI still saves time after checking/fixing 88% (15/17); reads most AI code 35% (6/17); rewrites at least a quarter of AI-generated code 47% (7/15); reports 2+ escaped AI bugs 80% (8/10); median weekly savings 20 h.
Moderate (n = 23): AI in at least half of work 57% (13/23); faster working code 91% (20/22); AI still saves time after checking/fixing 65% (15/23); reads most AI code 57% (12/21); rewrites at least a quarter of AI-generated code 33% (7/21); reports 2+ escaped AI bugs 61% (11/18); median weekly savings 15 h.
The first metric is intentionally kept for Heavy and Moderate users as well. Heavy means more than 75% of tasks with AI, so Heavy is 100% in the >=50% column. Moderate includes the 50-75% band, so 57% of Moderate users are still at or above half of their work with AI. Each of the other metrics has its own denominator.
How this connects to the first article
The July article summarized 31 external sources, not measurements from my own teams. The four questions were: Speed and Output, how fast and how much work gets done; Quality and Durability, how good the result is and whether it survives in the project; Build Success, whether the generated or migrated system can be built and run; Behavioral Equivalence, whether the new system preserves the behavior of the original.
The main conclusion was that AI has its clearest advantage in code creation speed, but that advantage does not automatically guarantee quality or preserved behavior. This survey follows the same framework through respondents' experience: speed, rework, verification and bugs. It does not directly test Build Success or full Behavioral Equivalence.
- Speed and Output: the earlier evidence favored AI on speed and output; here, 87% report reaching working code faster.
- Quality and Durability: the original review found no convincing AI win across eight direct quality comparisons; here, 39% substantially rewrite at least a quarter of AI code, while 47% of reviewed respondents receive fewer change requests.
- Behavioral Equivalence: This was the weakest aspect of AI in the context of modernization, and the same type of problem also appears in our survey. AI does not often fail in the area of syntax. It fails in context. In the free-text responses, 37% of respondents cited incorrect context or intent, 27% cited regression or disruption of existing behavior, and only 17% cited a purely technical error in the code. The examples repeatedly highlight hidden use cases and a lack of context specific to the given domain.
- Build Success: the earlier studies showed that code can build more often than it preserves behavior; this survey does not measure Build Success directly.
This is not a direct replication of the first article. Some dimensions are measured only indirectly. Build Success is not measured directly because in normal development the code eventually has to build, and if it does not, the developer keeps working until it does.
Hypothesis status in the article: green means supported within what we measured, orange means a positive signal or a hypothesis that is not yet convincingly confirmed. Not tested does not mean disproved.
From generation to proof
The further we move from generated code toward verified software running in a real system, the smaller AI's apparent advantage may become.
The bottleneck in AI-assisted development may be moving from code generation toward context and verification.
Result: Supported by the data.
Our data confirms this picture see Figure 2. The descending order does not prove that a single common benefit weakens with each step. Each question measures something different and has its own denominator.
The second part of the hypothesis has several separate signals behind it. Reading AI code is associated with fewer escaped bugs. On the other hand, reading is associated with lower self-reported weekly hour savings. Lack of context repeatedly appears in open answers. And more rework is associated with more errors found later. Each signal has different limitations, so I read them together rather than as one causal proof.
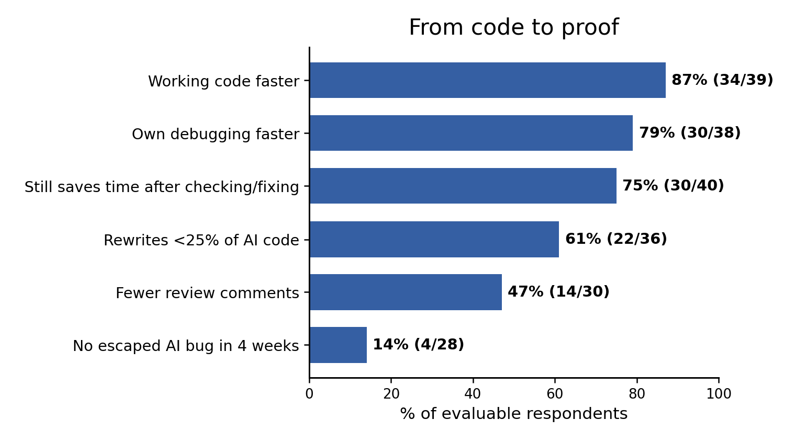
Figure 2. From code to proof
Six different questions are shown side by side, each with its own denominator. This is not a funnel and not the same people moving through six stages. The ordering cannot be used to calculate how much productivity is lost in verification.
1. Speed and Output: AI really is fast
87% of respondents who could judge reported getting working code faster with AI. When finding a bug in their own code, 79% report being faster with AI.
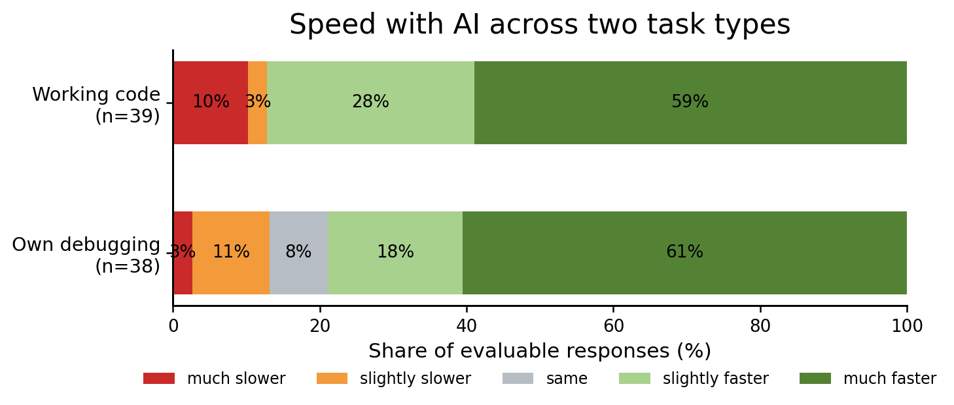
Figure 3. Speed
The two bars show self-reported speed for reaching working code and for debugging one's own code.
AI is used in at least half of work tasks by 75% of respondents. Among people who could estimate it, 67% reported that at least half of committed code was generated by AI.
Correlation: Share of work with AI vs. speed to working code: ρ = 0.36, p **, FDR q = 0.040, n = 39. More intensive AI use is associated with higher perceived speed.
Faster working code is reported by 94% of Seniors and 81% of Juniors. This is the experience-based comparison used throughout the article. The difference is not statistically significant in this small sample (Fisher exact test, p = 0.335). The idea that AI amplifies existing expertise is therefore an interesting working hypothesis, not a confirmed effect of seniority.
Result: AI clearly speeds up working code and debugging. The Senior-Junior difference is not statistically convincing.
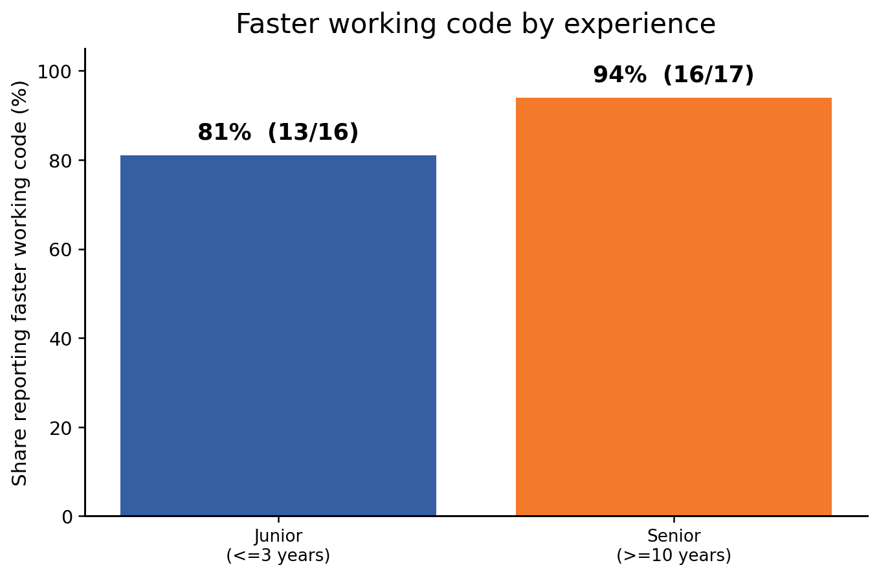
Figure 4. Faster working code: Junior vs. Senior
Junior means up to 3 years of experience, Senior at least 10. Junior 13/16 = 81%, Senior 16/17 = 94%. Fisher exact test p = 0.335. This uses the same speed data later shown in Figure 14.
2. The time saving survives some of the checking
75% of respondents say AI still saves time after checking and fixing are included. But among developers who reach working code faster, 29% no longer report a net coding time saving once checking and fixing are counted. Speed to the first working result is not the same as net time benefit.
Correlation: Share of work with AI vs. time saving after checking/fixing: ρ = 0.54, p ***, FDR q = 0.002, n = 40. More intensive AI use is associated with a more positive time effect after checking.
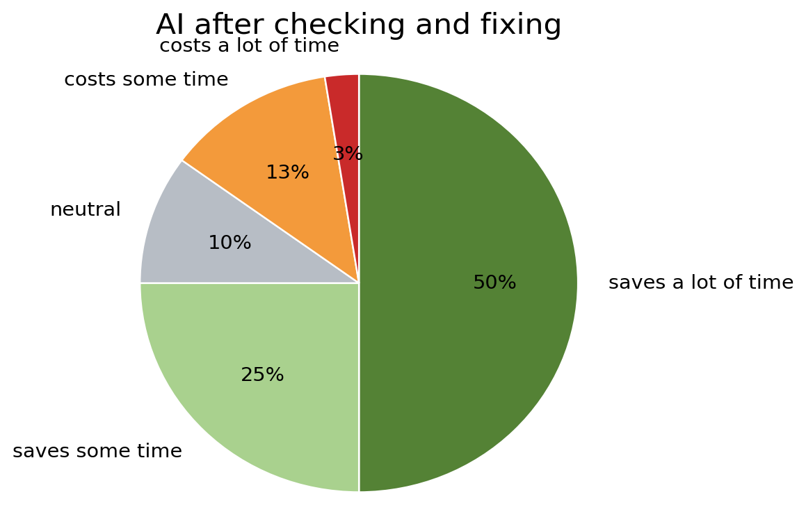
Figure 5. Effect after checking and fixing
Roughly three quarters say AI still saves time after checking and fixing. About one in six reports a negative effect.
A broader question about total weekly time saved has a median of 20 hours. The middle 50% of answers lie roughly between 10 and 25.25 hours. This is a self-reported estimate, not a direct productivity measurement.
Correlation: Share of work with AI vs. weekly hours saved: ρ = 0.52, p ***, FDR q = 0.004, n = 36. More intensive users typically report higher overall weekly savings.
In the article I published in July, I also cited the METR experiment using early-2025 tools. After the experiment, participants estimated that AI had saved them about 20% of their time. The measurement showed the opposite: with AI allowed, they needed 19% more time to finish the tasks. The important metric was time to task completion, not commit count. Perceived savings and measured outcomes can diverge. [2] Our survey cannot prove or disprove that effect.
My personal observation is that the perceived value of AI within developers is increasing over time. However, these two studies cannot confirm a long-term trend because they used different methodologies and involved different people, tasks, and units. Twenty hours cannot be directly compared to 20 percent.
By repeating the same survey on a similar sample in about six months or a year, we could verify this perception. However, measuring actual changes in productivity would still require directly measuring the time needed to perform comparable tasks.
Exactly 20 hours was reported by 10 of the 36 respondents who gave a numeric answer, 28%, so there is obvious rounding.
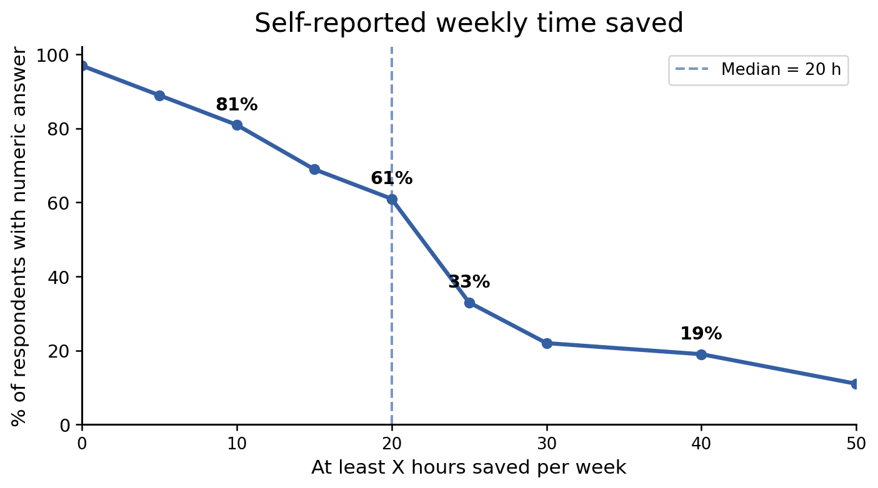
Figure 6. Weekly time saved - at least X hours
The median is 20 h. Exactly 20 h was reported by 10/35 respondents (29%). All four estimates in the 50-100 h range come from people who read at most half of AI code; three of the four are Heavy users and three of the four are students.
Result: AI still saves time for most respondents after checking and fixing, but 29% of those who reach working code faster no longer report a net coding time saving once checking and fixing are included.
3. Rework is a cost, and possibly a symptom
61% of code writers substantially rewrite or discard less than a quarter of AI-generated code. 39% rewrite at least a quarter, and 14% rewrite half or more.
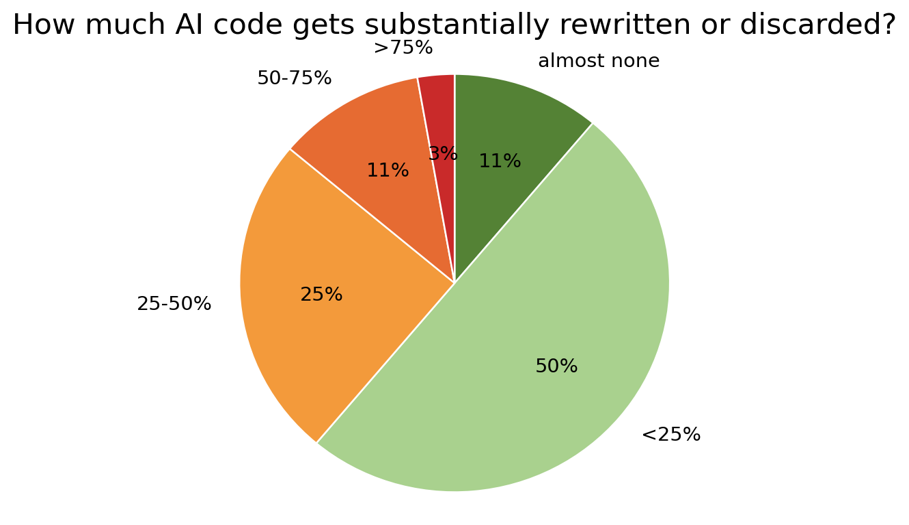
Figure 7. Rework of AI-generated code
61% of code writers rewrite less than a quarter of AI code; 14% rewrite half or more. Percentages are based on respondents who write code.
The larger the share of AI code a person rewrites, the more often they report errors found in testing, review or by a customer: Spearman correlation rho = +0.50 (p = 0.0103; n = 25) **.
How did we get there? We ranked people by the share of code they rewrite and by the frequency of reported errors. People higher in one ranking often appeared higher in the other. The positive sign means the rankings move in the same direction. +0.50 is a clear but far from perfect relationship. It does not mean 50% more bugs. It also does not prove that rewriting causes the errors. It may mean that both answers reflect harder tasks or a weaker fit between AI and the problem.
Correlation: Rework vs. perceived time saving after checking/fixing: ρ = -0.17, p -, FDR q = 0.335, n = 36. No clear relationship is visible between rework and perceived time effect.
The review result is positive. Among respondents whose code is reviewed, 47% said they receive fewer requests for changes on AI-assisted code than without AI. 20% said they receive more. The remaining roughly 33% report about the same level.
Result: Most AI-generated code survives with limited rework: 61% rewrite less than a quarter, and 47% of reviewed respondents receive fewer change requests. More rework is also associated with more errors found later.
4. AI is no longer just a code generator
AI is used across the development lifecycle, as shown in Figure 8.
Productivity should therefore not be measured only by coding speed. Time can also be saved in debugging, documentation, review and understanding the system.
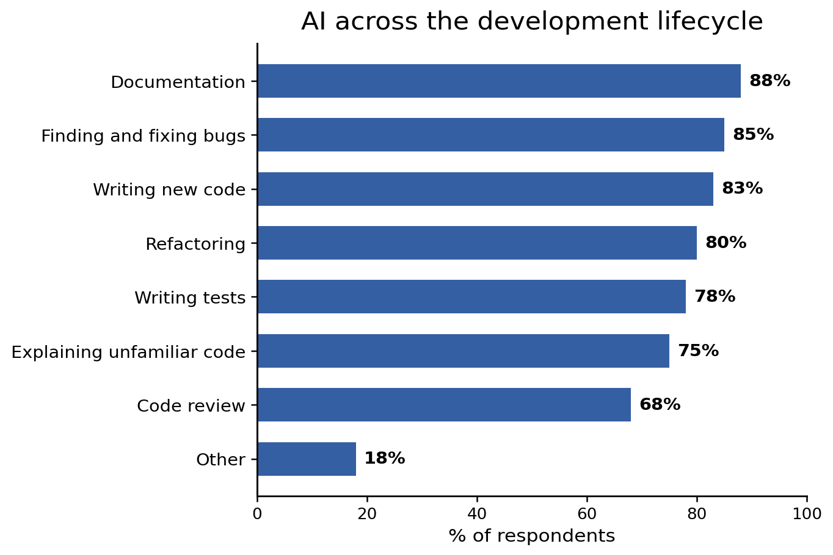
Figure 8. What AI is used for
AI is not just a code generator. Documentation and finding/fixing bugs are the two most common uses. This was a multi-select question.
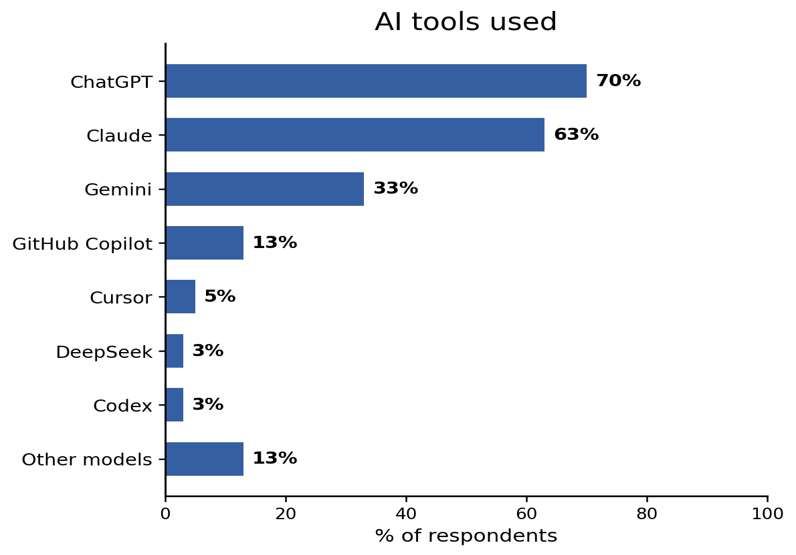
Figure 9. AI tools used
Conversational assistants dominate. Tools directly integrated into the editor are used by a minority. Percentages do not add to 100% because this was a multi-select question.
Result: AI is already used across the development lifecycle, not only for code generation.
5. Verification is becoming part of the AI workflow
47% of code writers read most or almost all AI-generated code line by line. 88% run the code and try it, 53% write or run tests, and 38% use an automatic build/test step.
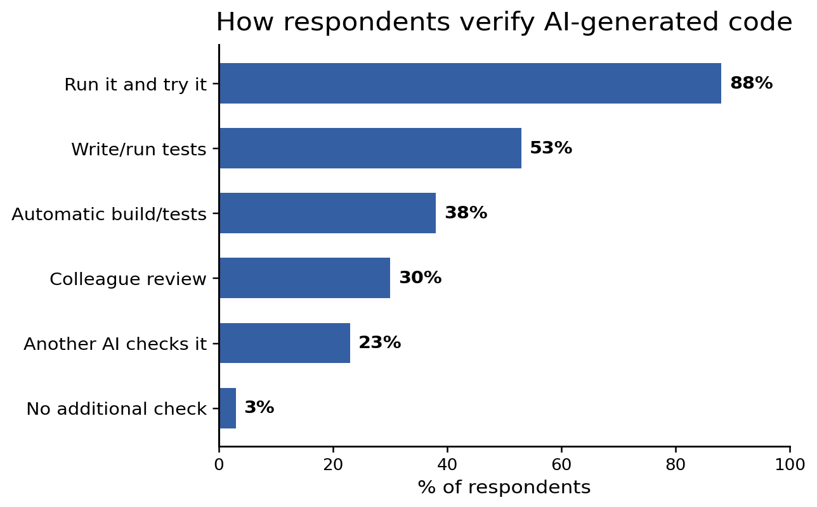
The first check is almost always running the code. Automatic build/test is used by 38%, which means a substantial part of verification still depends on manual work and human review.
Heavy AI users write or run tests more often than Moderate users, 65% versus 43%. This is a descriptive difference.
AI also helps when reviewing other people's code. Among reviewers who use AI during review, 85% say AI helps them find bugs in a colleague's code more effectively.
Visibility may also depend on whether someone acts as a reviewer. Reviewers were more likely to know whether an AI bug had escaped into the repository. The answer "I don't know" was given by 17% of reviewers versus 47% of people who do not review colleagues' code (Fisher p = 0.08) *. The difference is not convincing at this sample size, but the direction supports the idea that review can help make the origin and consequences of AI-generated errors more visible.
Result: Verification remains a substantial part of the AI workflow, and review may make AI-generated errors more visible.
6. More code reading is associated with fewer escaped bugs
Among respondents who could answer the question, 86% had seen at least one case in the previous four weeks where a bug from AI code made it into the repository. 68% had seen at least 2-3 such cases.
The simplest split is easy to read: 87% of people who read at most half of AI code reported two or more escaped bugs (13/15), compared with 46% among those who read most or almost all of it (6/13). Fisher p = 0.042 **.
The same pattern appears statistically. The larger the share of AI code people read line by line, the fewer escaped AI bugs they report. The relationship is fairly strong (Spearman rho = -0.55, p = 0.0025 ***).
Correlation: AI code reading vs. escaped AI bugs: ρ = -0.55, p ***, FDR q = 0.006, n = 28. People who read more AI code typically report fewer escaped bugs.
We also checked whether the result could simply come from some people using AI for a larger share of their code and therefore having more opportunities for an AI bug to appear. After accounting for the share of AI-assisted code, the relationship is still visible (partial correlation about -0.46, p = 0.017 **).
Correlation: Share of AI code vs. escaped AI bugs: ρ = 0.39, p **, FDR q = 0.048, n = 28. More AI-assisted code is associated with more escaped bugs; greater exposure may contribute.
Put simply: our data supports the idea that thorough reading of AI code matters. It is still an association, not proof that reading itself prevents bugs.
We do not have a sample comparison of code written without AI. These numbers cannot tell us that AI code is more bug-prone than human code, or the reverse. They only describe the relationship between how much AI code people read and the escaped AI bugs they report in this sample.
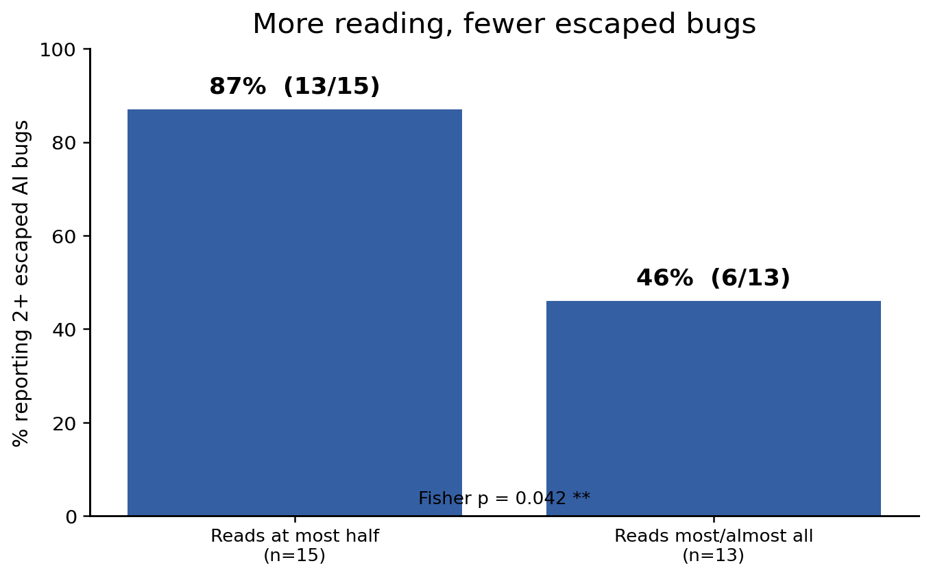
Figure 11. More reading, fewer escaped bugs
2+ escaped bugs in the previous four weeks were reported by 13/15 low-readers versus 6/13 high-readers. Fisher p = 0.042 **. This is an association; groups may also differ in task type, experience or amount of AI code.
Result: People who read more AI-generated code report fewer escaped bugs.
7. What does proof cost?
The previous finding suggests that reading more AI-generated code is associated with fewer escaped bugs. But does this additional scrutiny come at a cost in productivity? Our data suggests a trade-off.
People who read most or almost all AI code report a median weekly saving of 15 hours. Other code writers, those who read at most half, report a median of 25 hours. Mann-Whitney p = 0.017 **.
Correlation: AI code reading vs. perceived time saving after checking: ρ = -0.33, p **, FDR q = 0.048, n = 38. People who read more AI code typically perceive a smaller coding time saving.
The gap also appears descriptively after splitting Heavy and Moderate users. Among Heavy users, the median is 20 h with more reading versus 30 h when reading at most half. Among Moderate users it is 10 h (heavy readers) versus 17.5 h (max. half readers). The subgroups are small, so I do not treat this as independent confirmation. The safest conclusion is that more precise checking is associated with lower self-reported time savings in this sample.
What we build also matters. In a new application, we mainly verify that the new solution meets the specification. In legacy modernization, Behavioral Equivalence matters as well: existing rules, workflows, exceptions and integrations must continue to work. The amount of verification needed may therefore be different. This survey did not measure the cost of these two development contexts separately, so this is context, not a measured difference.
Verification did not disappear. Alongside generation speed, we have to value the work required to prove the result.
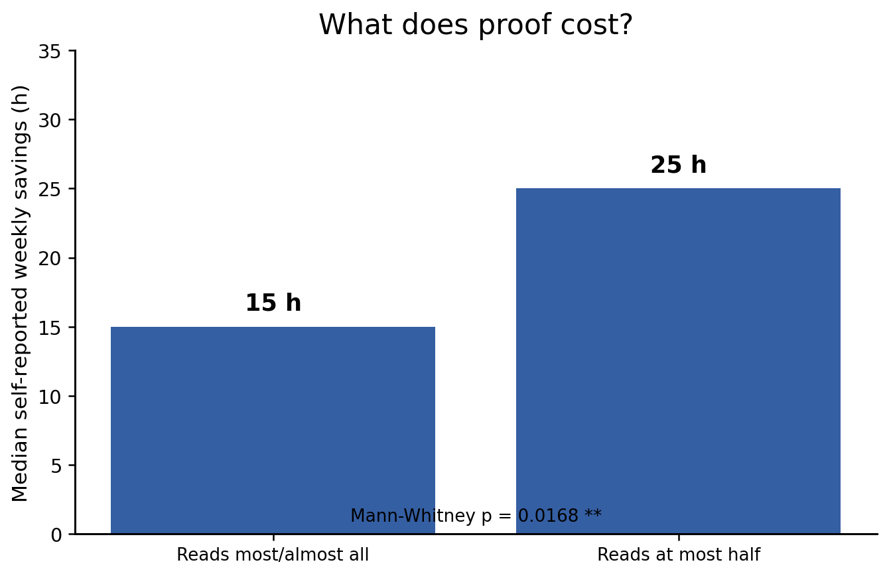
Figure 12. What does proof cost?
Median self-reported weekly savings are 15 h among people reading most AI code (n = 15) and 25 h among those reading at most half (n = 19). Mann-Whitney p = 0.0168 **. The 10 h difference is an association, not a measured cost of verification.
Result: More thorough code reading is associated with lower self-reported time savings, 15 h versus 25 h median per week.
8. Heavy vs. Moderate AI users
Heavy users (>75% of work tasks with AI) and Moderate users (<=75%) do not differ much in speed to working code: 82% versus 91%. The gap is larger in perceived net coding benefit after checking/fixing: 88% versus 65%.
Heavy users also read most AI code more often (57% versus 35%) and, among those who could answer, more often report 2+ escaped bugs in the last 4 weeks (80% versus 61%). Greater exposure to AI code may explain part of that difference. I do not infer causality from this comparison.
Result: Heavy users report a higher net coding benefit, but also read less AI code and report more escaped bugs. Greater AI exposure may explain part of the difference, but not all of it.
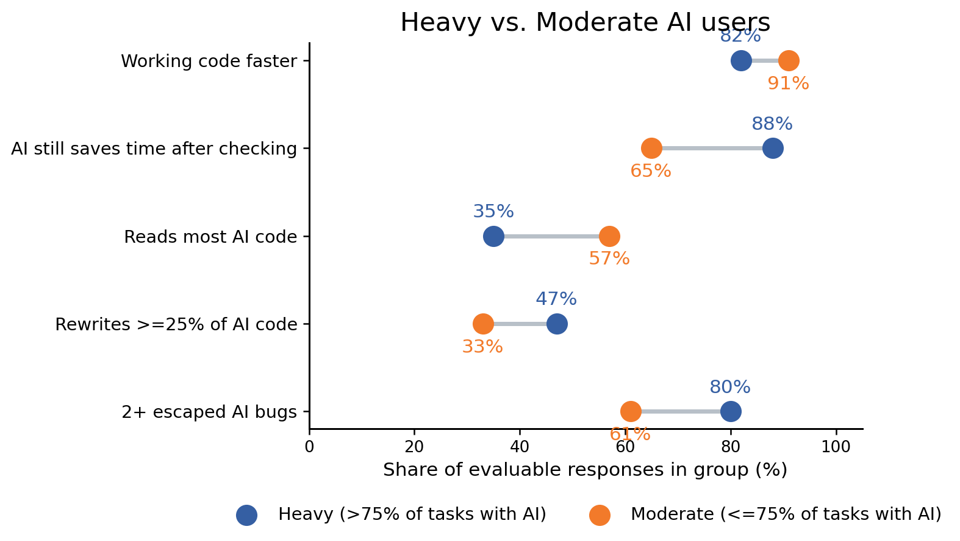
Figure 13. Heavy vs. Moderate AI users
Heavy users report a higher net coding benefit, read most AI code less often, and more often report 2+ escaped bugs. They also write/run tests more often, 65% versus 43%. Greater AI exposure is one possible explanation; the figure is descriptive.
9. Juniors and Seniors
Faster working code is reported by 81% of Juniors and 94% of Seniors. At least a quarter of AI code is rewritten by 25% of Juniors and 53% of Seniors. The rework difference has Fisher p = 0.15 *, a signal in this sample, not a firm conclusion.
One possible interpretation is that Seniors are stricter with AI output or work on more context-heavy tasks. The survey does not directly measure the reason for rework or task complexity.
Result: Seniors rewrite AI code more often; the reason remains open.
The language of the open answers differs as well. Juniors more often talk about prompts, tools and learning. Seniors more often talk about architecture, domain knowledge and hidden use cases. I treat this as a qualitative observation, not a hard conclusion.
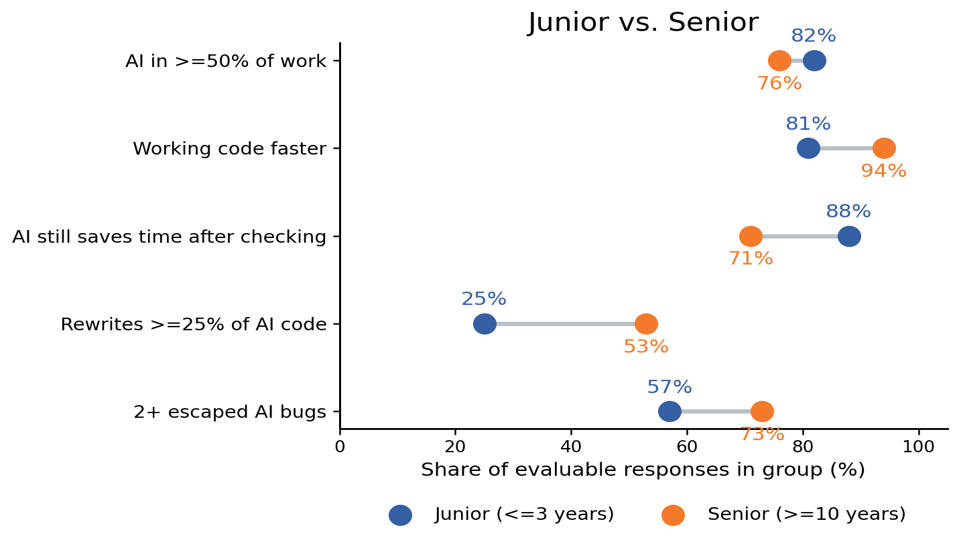
Figure 14. Junior vs. Senior
Blue is Junior and orange is Senior. Each metric has its own evaluable denominator. Rework 25% (4/16) versus 53% (8/15) has Fisher p = 0.1489 *. The figure does not separate years of experience from role, task type or AI intensity.
Qualitative questions - thematic coding
The themes below were created by manual analytical coding of free-text answers. One answer can belong to more than one theme, so percentages do not have to add to 100%. Percentages are based only on respondents in the group who answered that specific open question.
Where people do not give AI the final word
Human judgment, architecture and high-stakes decisions: Junior 31%, Senior 73%, Heavy 46%, Moderate 61%, overall 55%.
AI almost everywhere or no fixed boundary: Junior 31%, Senior 18%, Heavy 31%, Moderate 17%, overall 23%.
Practical limits, context and overhead: Junior 25%, Senior 18%, Heavy 15%, Moderate 22%, overall 19%.
Response coverage, responses were non mandatory: Junior 94%, Senior 65%, Heavy 76%, Moderate 78%, overall 31/40.
What would help people use AI more effectively
More context, code, data and integration: Junior 24%, Senior 36%, Heavy 31%, Moderate 26%, overall 28%.
More knowledge, training and workflow discipline: Junior 29%, Senior 18%, Heavy 8%, Moderate 37%, overall 25%.
Better models, UX and tool limitations: Junior 29%, Senior 18%, Heavy 31%, Moderate 21%, overall 25%.
Nothing major, the tools are already enough: Junior 18%, Senior 27%, Heavy 23%, Moderate 21%, overall 22%.
Response coverage, responses were non mandatory: Junior 100%, Senior 65%, Heavy 76%, Moderate 83%, overall 32/40.
10. Behavioral Equivalence: Webswing as a case study
We asked respondents for concrete examples of AI failure. The recurring categories are wrong context, drifting away from the intent, over-engineering, failures in testing, and regressions in existing behavior. A pure technical error in generated code is only one category.
When AI spoiled the work or cost time
Wrong context, wrong intent or unnecessary work: Junior 47%, Senior 30%, Heavy 45%, Moderate 32%, overall 37%.
Regressions, testing problems and breaking existing behavior: Junior 27%, Senior 40%, Heavy 18%, Moderate 32%, overall 27%.
No significant problem or no example: Junior 33%, Senior 20%, Heavy 45%, Moderate 21%, overall 30%.
Pure technical error in generated code: Junior 7%, Senior 20%, Heavy 18%, Moderate 16%, overall 17%.
Response coverage, responses were non mandatory: Junior 88%, Senior 59%, Heavy 65%, Moderate 83%, overall 30/40.
The most common failure is not a pure technical coding error. It is wrong context or intent, and breaking existing behavior. Exactly the kind of problem that matters in Behavioral Equivalence.
AI can solve A locally and still break B systemically.
Even among people who use test-based verification, a difference by code reading remains visible. 2+ escaped bugs are reported by 85% of those who read at most half of AI code, versus 40% among those who read most or almost all of it. Fisher p = 0.039 **. This is a signal, not proof that tests are inadequate. It suggests that tests and human reading may catch different kinds of problems.
Result: The main failures are contextual and behavioral rather than purely technical. The data also support combining tests with human reading.
In legacy modernization, Webswing has an unfair advantage that normal greenfield development does not have: the original application. While it still runs, it can act as a behavioral oracle, a source of truth against which the new result can be compared. Every modernized screen or workflow can be checked against a system that has already learned all the tribal knowledge and exceptions nobody wrote down because, "this is just how we do it."
Webswing primarily develops modernization tools, not the customer applications themselves. Comparing old and new behavior therefore remains an option for the customer using those tools. This survey does not directly measure the success of specific modernization projects. But legacy modernization is one of the best possible environments for verifying Behavioral Equivalence because the original application still exists and can serve as a reference for what must be preserved.
Three management takeaways
1. Do not measure AI usage on how much people use it. Manage how its output is verified.
87% of respondents reach working code faster with AI. But more AI usage does not automatically mean better results. Managers should focus on delivered value and establish clear rules for verifying AI-generated code.
2. Speed creates value. Verification protects it.
A more thorough review of code generated by AI results in fewer undetected errors, but also yields fewer time savings. The challenge is to strike a balance between productivity and quality. Measure the time required to achieve verified results, not just the time required to write the code.
3. AI may amplify experience. Invest in people, not just tools.
94% of Seniors reach working code faster with AI, compared with 81% of Juniors. While the difference is not statistically conclusive, it suggests that experience matters. AI investment should go hand in hand with developing human expertise.
Three questions for discussion
- How does your team decide how much verification AI-generated code needs?
- Which parts of verification can a machine do in your environment, and which still need a person?
- What is the cheapest proof in your environment that the code does what it is supposed to do?
Methodology and statistical details
Sample profile
- 40 responses; seniority known for 39.
- 17 Juniors (<=3 years), 5 Mid-level respondents (4-9 years), 17 Seniors (>=10 years), 1 respondent with unknown experience.
- 12 respondents had student roles.
- Average experience: 9.3 years. Median experience: 5.0 years.
The sample is uneven by design. Student roles are combined into one profile number, but analytical comparisons are based on years of experience.
Method
Data were collected from September 28 to October 8, 2026, exclusively through an online Jotform survey. The analysis uses 40 responses and 20 questions in blocks A-F. Three questions, F1-F3, were open text. Years of experience and roles were added by the author, who knows the respondents personally.
Multiple-choice responses were broken down into individual options. The “Other” category includes respondents who listed at least one additional use or tool. Each person is counted only once within a given category but may belong to multiple analytical groups, such as the “Junior” and “Heavy” groups. Therefore, the sum of the percentages does not always equal 100%. Missing or unevaluable responses are excluded from the denominator for a given question.
How to read the statistical tools
Spearman correlation rho: for each respondent we compare two ordered answers. Respondents are ranked on the first and the second answer; ties receive average ranks. We then compare those rankings. +1 means the same ranking, -1 the opposite ranking, and a value near zero a weak rank relationship. We do not need to assume equal distances between verbal categories. For code reading and escaped bugs, rho = -0.55. For rework and errors found in testing/review, rho = +0.50. The coefficient is not a percentage change and does not prove causation. [3]
Partial Spearman: this checks one possible third explanation. We convert all three variables to ranks, statistically remove the part associated with AI code share, and compare the remaining deviations. After accounting for AI code share, the reading-versus-bugs relationship moves from -0.55 to about -0.46 (n = 28; p = 0.0169). The direction remains but is weaker. This does not control for task difficulty, experience or the absolute volume of code.
Fisher exact test: this compares two proportions using actual counts rather than rounded percentages. It works well with small groups. Among people reading at most half of AI code, 13 of 15 report 2+ escaped bugs; among the others, 6 of 13. The two-sided test gives p = 0.0418 (**). For Junior/Senior rework, p = 0.1489 (*), a signal rather than a firm difference. [4]
Mann-Whitney U: this compares numeric or ordered answers between two groups by ranking all values together. A value of 100 h does not weigh four times as much as 25 h; its position in the ranking matters. For weekly savings, the two reading groups have medians of 15 h and 25 h, U = 74.0, p = 0.0168 (**). The test does not say that verification itself caused exactly 10 hours of cost. [5]
p-value and stars: the p-value tells us how strongly the data is supporting the existence of a difference or relationship. The lower it is, the less likely it is that the observed result arose only by chance. It does not tell us how large or important the effect is. Stars are shorthand: *** below 0.01; ** from 0.01 to below 0.05; * from 0.05 through 0.15; no star above 0.15.
FDR / BH correction: when we examine several relationships, we create more opportunities to find something interesting by chance. The Benjamini-Hochberg procedure adjusts the p-values for the number and ranking of tests. Adjusted values are shown as q. We apply it to the seven correlations above. Reading/bugs: p = 0.0025 -> q about 0.006. Reading/time saving after checking: p = 0.0412 -> q about 0.048. q < 0.05 does not mean there is less than a 5% probability that this specific conclusion is wrong. [6]
Stars next to the p follow the same thresholds used above (0.01; 0.05; 0.15). FDR q adjusts the seven correlations for multiple testing. Six of the seven have q < 0.05, but none of these relationships is a causal effect. The partial correlation, Fisher tests, Mann-Whitney test and the rework-versus-later-errors analysis are separate follow-up analyses outside this FDR family.
Self-reported data: respondents describe their own experience and estimates. This tells us how people use AI and what they perceive. Direct measurement would additionally track time, errors and outcomes under common rules. The two types of evidence complement each other but are not interchangeable. "AI saves me 20 hours a week" is a declared estimate, not a stopwatch measurement or an experiment on the same task with and without AI.
Limitations
The sample does not represent all developers.
- It includes development, QA, support and other technical roles. Junior/Senior is based on years of experience, not automatically on job title.
- Junior/Senior and Heavy/Moderate are two overlapping views of the same sample, not independent groups across both axes.
- Results are self-reported. We do not measure objective time or defect rates directly from repositories.
- There is no clean non-AI control group.
- Figure 2 combines different questions and denominators. Its ordering does not by itself prove that one common benefit declines step by step.
- Build Success and Behavioral Equivalence are not measured directly. Behavioral Equivalence appears mainly in qualitative examples of regressions and hidden use cases.
- Free-text thematic coding is an analytical interpretation, and categories can overlap.
- Weekly hours saved contain strong rounding and extreme self-reported values. I therefore interpret them through medians, quartiles and thresholds, not as a precise population productivity gain.
- The author works with both companies mentioned in the introduction and was involved in the survey and analysis.
Sources and methodological references
[1] Igor Gembula. Is AI Coding Better Than Human Coding? Review article, July 2026. https://www.linkedin.com/pulse/ai-coding-better-than-human-igor-gembula-cgvnc/
[2] METR. Measuring the Impact of Early-2025 AI on Experienced Open-Source Developer Productivity. July 10, 2025. https://metr.org/blog/2025-07-10-early-2025-ai-experienced-os-dev-study/
[3] SciPy. Spearman correlation and p-value. https://docs.scipy.org/doc/scipy/reference/generated/scipy.stats.spearmanr.html
[4] SciPy. Fisher exact test. https://docs.scipy.org/doc/scipy/reference/generated/scipy.stats.fisher_exact.html
[5] SciPy. Mann-Whitney U test. https://docs.scipy.org/doc/scipy/reference/generated/scipy.stats.mannwhitneyu.html
[6] SciPy. False discovery rate and Benjamini-Hochberg correction. https://docs.scipy.org/doc/scipy/reference/generated/scipy.stats.false_discovery_control.html